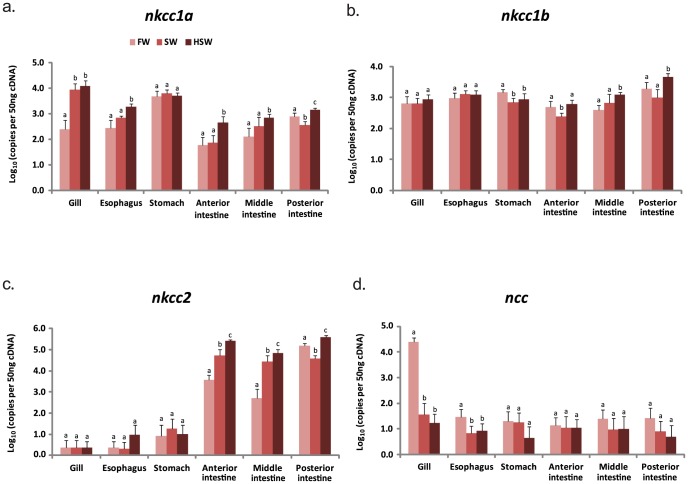
Figure 1. Gene expression of sodium (potassium) chloride (nkcc/ncc) cotransporters.
Expression levels of nkcc1a (a), nkcc1b (b), nkcc2 (c), ncc (d), in the gills and EGI tract of tilapia acclimated to freshwater (FW), seawater (SW) and hypersaline water (HSW). Each histogram bar represents the mean ± s.d. of the expression levels (log10 copies of transcript per 50 ng cDNA). Expression levels labeled with different lowercase alphabets are significantly different (one-way ANOVA followed by Duncan's post-hoc test; P<0.05) within the same tissue.

