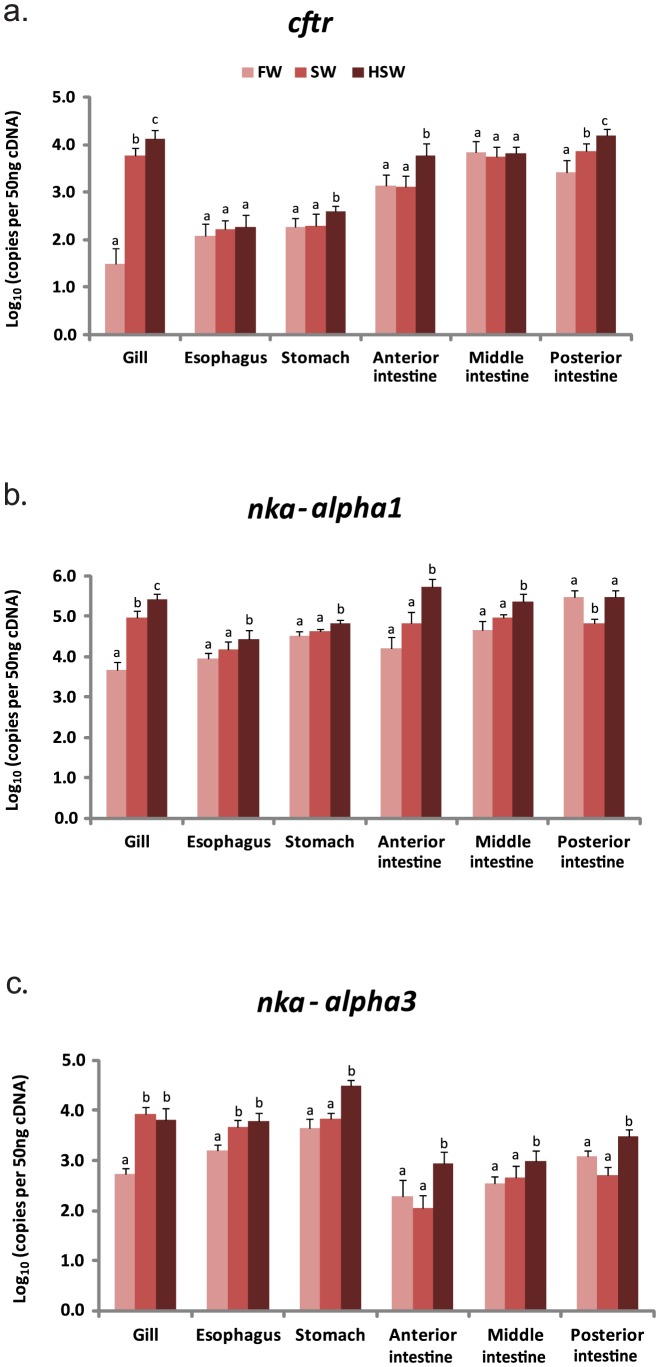
Figure 2. Gene expression of cystic fibrosis transmembrane conductance regulator (cftr) and sodium potassium ATPases (nka).
Expression levels of cftr (a), nka-α1 (b), nka-α3 (c) in gills and EGI tract of tilapia acclimated to freshwater (FW), seawater (SW) and hypersaline water (HSW). Each histogram bar represents the mean ± s.d. of the expression levels (log10 copies of transcript per 50 ng cDNA). Expression levels labeled with different lowercase alphabets are significantly different (one-way ANOVA followed by Duncan's post-hoc test; P<0.05) within the same tissue.

