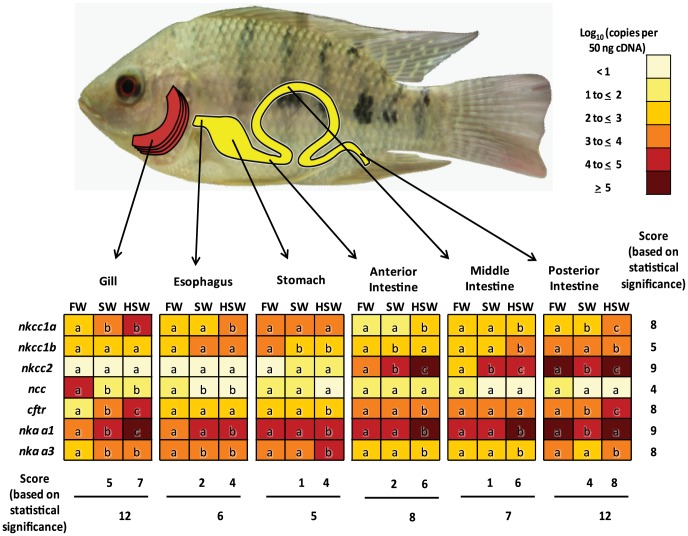
Figure 3. Gene expression profiles in gills and gastro-intestinal tract of tilapia acclimated different salinities.
Heatmap representing quantity (log10 copies per 50 ng cDNA) of nkcc1a, nkcc1b, nkcc2, ncc, cftr, nka-α1, and nka-α3 in the gills and EGI tract segments, including the esophagus, stomach, anterior intestine (AI), middle intestine (MI), and posterior intestine (IG) of tilapia acclimated freshwater (FW), seawater (SW) and hypersaline water (HSW). Different alphabets indicates significant (P<0.05) differential gene expression between the salinity conditions (refer to text for the scoring system) within a tissue.

