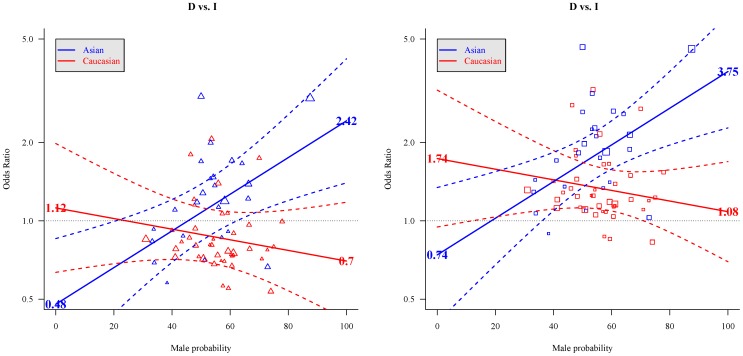
Figure 3. Gender-dependent effects of ACE I/D and all-cause CKD in each population.
Left figure was showed the OR in people without hypertension; right figure was showed the odds ratio in patient with hypertension. Red triangle and square: individual studies in Caucasian; blue triangle and square: individual studies in Asian. Solid line: unbiased estimator of odds ratio; dashed line: 95% confidence interval of odds ratios. Estimated value of log odds ratio in individual studies without hypertension used following formula: observed log odds ratio – hypertension prevalence of study population×0.437 (according to Model 2 in Table 5) Estimated value of log odds ratio in individual studies with hypertension used following formula: observed log odds ratio+(1– hypertension prevalence of study population)×0.437 (according to Model 2 in Table 5).

