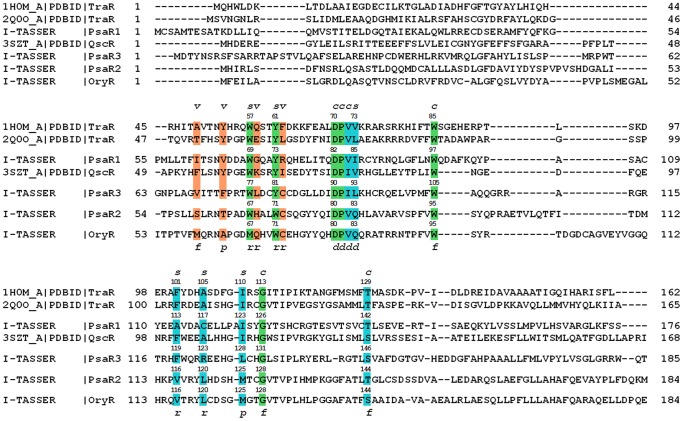
Figure 1. Structure-based multiple sequence alignment of the regulatory domains of the three Psa solos with QS LuxRs and with the prototype of the PAB LuxR solos subfamily.
The residues belonging to Cluster 1, to Cluster 2 and Cluster 3 are highlighted in green, cyan and in orange, respectively. The 3D architecture of the boundaries of the ligand-binding site is schematized by r (roof), f (floor), p (proximal wall) and d (distal wall) and its tripartite topology by c (conserved core), s (specificity patch) and v (variable patch).

