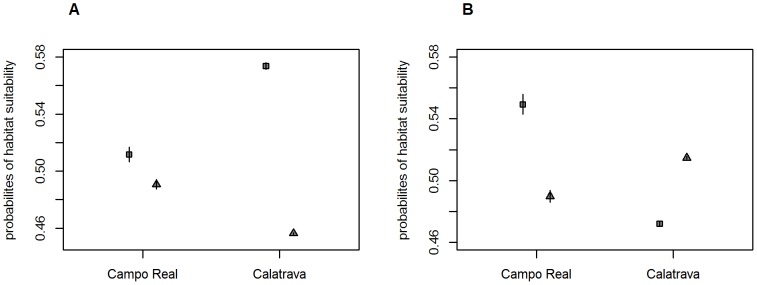
Figure 5. Probabilities of habitat suitability of coexistence and exclusive use areas.

Mean and 95% confidence interval of probabilities of habitat suitability in coexistence and exclusive use areas for the Little (A) and Great Bustards (B) in Campo Real 2011 and Calatrava 2008. Student t tests were performed with the residuals of the polynomial regression although original probabilities are shown for the sake of interpretation. Probability means of coexistence areas are represented as triangles and probability means of exclusive use areas are represented as squares.
