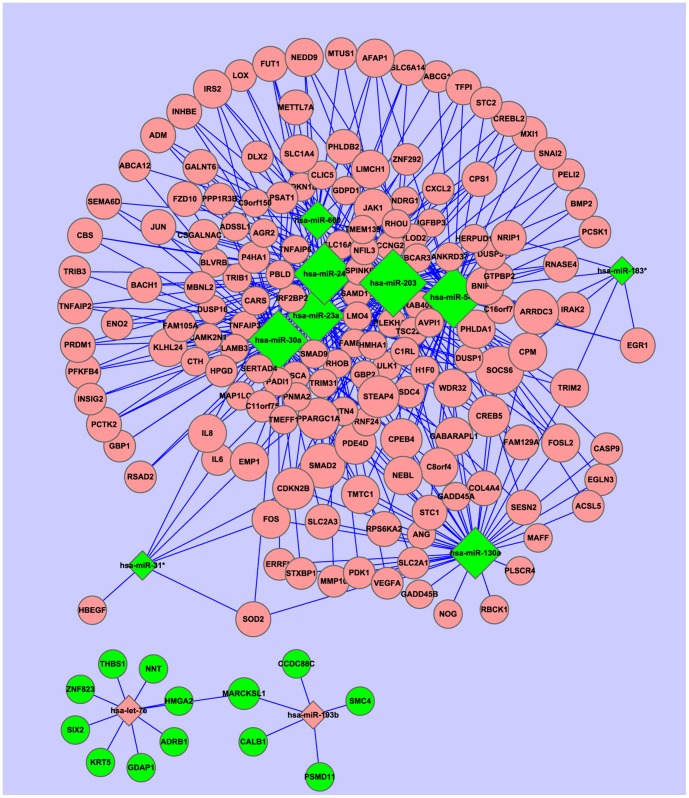
Figure 2. The posttranscriptional regulatory network of miRNAs and target genes in the radioresistant NPC cells.
Eleven miRNAs and 174 target genes with an inverse correlation of expression were built into a bipartite network using Cytoscape v2.6. The diamonds and ellipses represent the miRNAs and genes, respectively. The red and green colors represent the relatively high and low expression, respectively. The larger geometric drawing indicates the more miRNAs or genes interacted with it.

