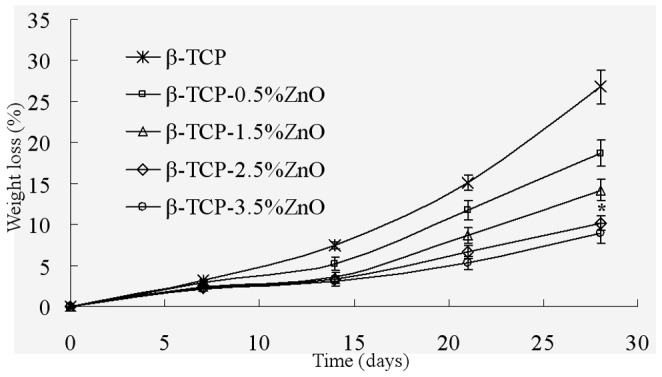
Figure 8. Weight loss assay of the scaffolds after incubation with SBF for different days.

Data represents mean ± standard deviation for n = 6, *P<0.05 (compared to pure TCP scaffold).

Data represents mean ± standard deviation for n = 6, *P<0.05 (compared to pure TCP scaffold).