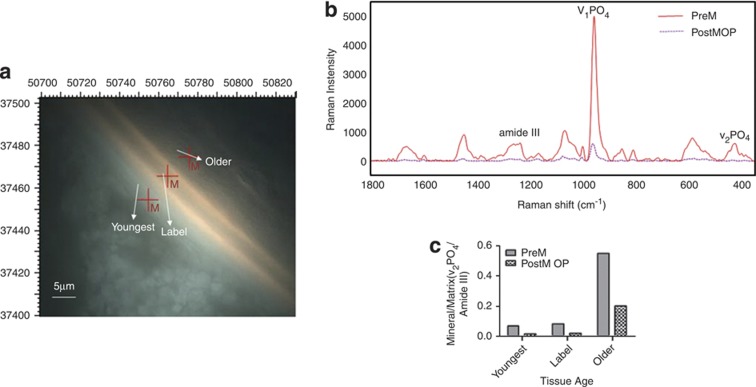
Figure 4.
Raman analysis. (a) Image as seen under the Raman microscope showing the double tetracycline labels used to define newly formed trabecular bone, the three areas examined are shown. (b) Typical Raman spectra of bone from a premenopausal woman and a woman with osteoporosis. (c) Mean values for the indicated parameters calculated from the Raman spectra of these two patients. Figure courtesy of Dr Lefteris Paschalis.

