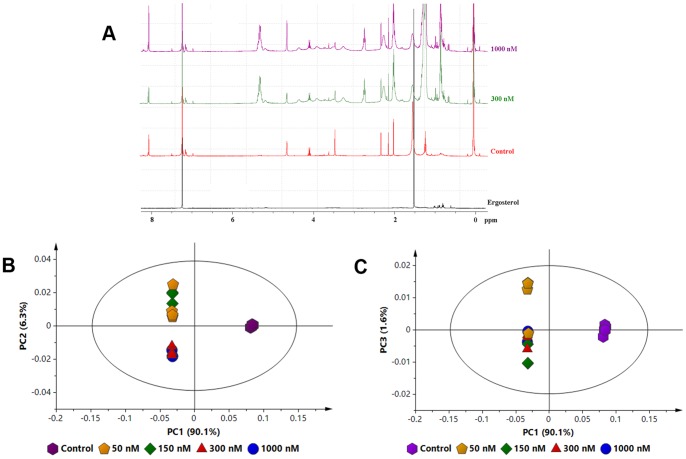
Figure 1. Proton NMR spectra of extracts from ergosterol-treated cells.
(A) Overlaid 1H NMR spectra of DLLME samples representative of control, 300 nM and 1000 nM ergosterol-treated tobacco cells showing differences in proton shifts/signals due to ergosterol-induced changes across the 1–8 ppm region of the spectrum. The 1H NMR spectrum of ergosterol is at the bottom. Deuterated chloroform was used as the solvent; however, since deuteration is not 100%, the residual protons from chloroform (CHCl3) give a singlet signal at 7.26 ppm. (B) and (C) PCA scores plots of the 1H NMR data from the concentration study. DLLME extracts of the cells treated with 0 (control), 50, 150, 300 and 1000 nM ergosterol, and incubated for 18 h. The scores plots shows the clustering/separation of different treatments with little variation within each group.

