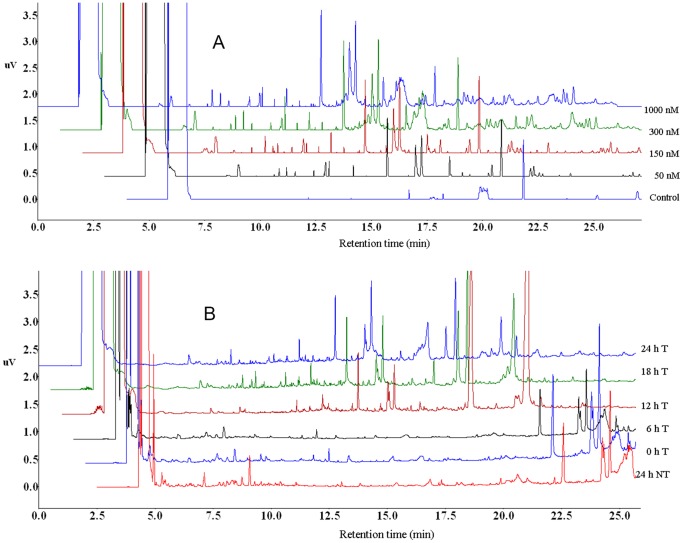
Figure 3. GC-FID chromatograms of DLLME extracts of ergosterol-treated (T) tobacco cells.
(A) Chromatograms showing the differences between the control/non-treated cells (0 nM) and ergosterol-treated cells (50–1000 nM) incubated for 18 h. From bottom to top: 0 (control), 50, 150, 300 and 1000 nM. (B) Chromatograms showing time-dependent variations of extracts of tobacco cells treated with 300 nM ergosterol and incubated for different time periods (0, 6, 12, 18 and 24 h T). The bottom chromatogram is a non-treated (NT) sample incubated for 24 h (24 h NT).

