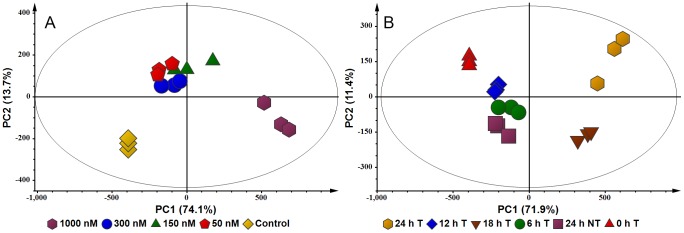
Figure 4. PCA scores plots of the GC-FID concentration- and time study data.

(A) DLLME extracts of cells treated with 0 (control), 50, 150, 300 and 1000 nM ergosterol, and incubated for 18 h. The scores plot shows the clustering of different treatments (0–1000 nM) with little variation within each group. The 50–300 nM clusters appear to group together. The 0 nM (control) samples are clearly separated from the treated samples. (B) DLLME extracts of cells treated with 300 nM ergosterol and incubated for different time periods (0–24 h T) and non-treated samples incubated for 24 h (24 h NT). The scores plot shows the clustering of the different treatments, with the 18 h- and 24 h-treated samples being significantly separated from the other samples.
