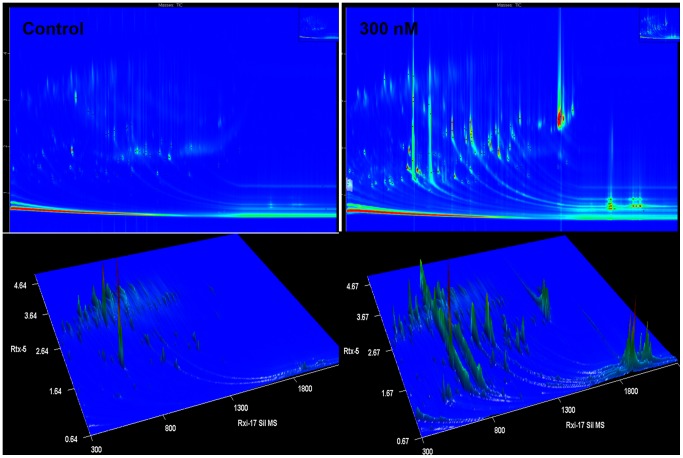
Figure 5. Representative 2D and 3D TIC chromatograms from the GC×GC-TOF-MS analyses.
The representative 2D/3D TIC chromatograms of the DLLME samples show differences in terms of the number of ion peaks detected and the variation in peak intensities between non-treated and 300 nM ergosterol-treated samples, incubated for a period of 18 h.

