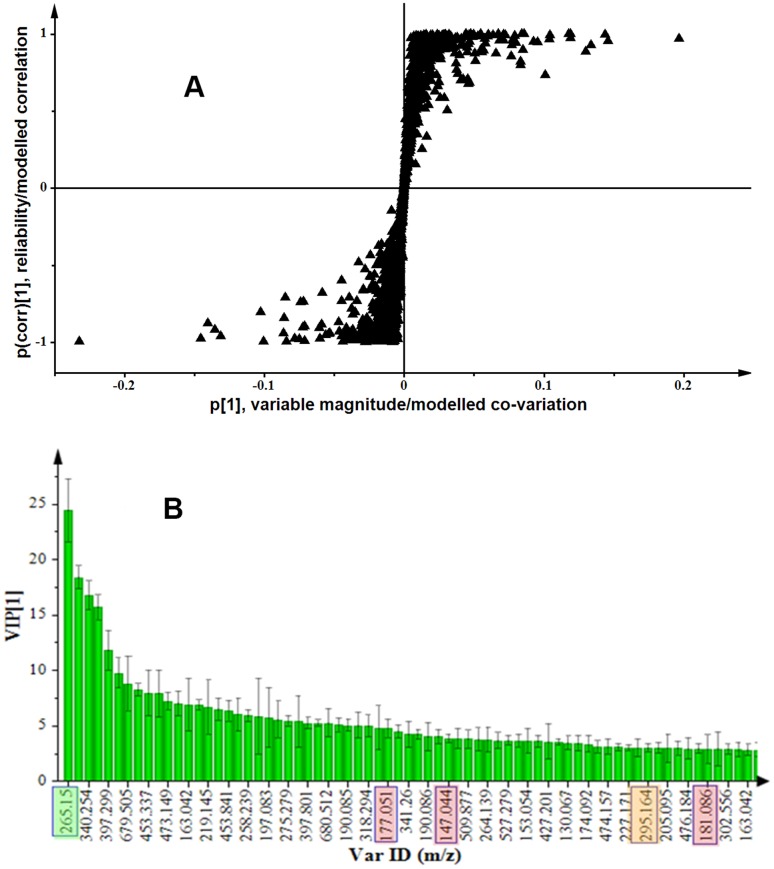
Figure 6. OPLS-DA modelling of data from ergosterol-treated cells.
(A) S-plot of an OPLS-DA model of control vs. 300 nM ergosterol-treated sample extracts (ME/UHPLC-MS data, ESI positive). The x-axis is the modelled covariation (variable magnitude) and the y-axis is the loading vector of the predictive component (modelled correlation/reliability). The mass ions in the upper right quadrant of S-plot are positively related to the ergosterol treatment (these include ions m/z 265.15, 177.051, 147.044 and 181.086), while those in the lower left quadrant are negatively related to the treatment. (B) A variable importance in projection (VIP) plot for an OPLS-DA model of 300 nM-treated samples. The VIP plot indicates for instance that the mass ions m/z 256.15, 177.051, 147.044, 295.164 and 181.086 (identified as deoxy-capsidol, methyllumbeliferone, coumarin, epi-hydroxyjasmonic acid and coniferyl alcohol, respectively, Table 1) were accountable for the significant separation in the model as their VIP scores were significantly greater than 1.0.

