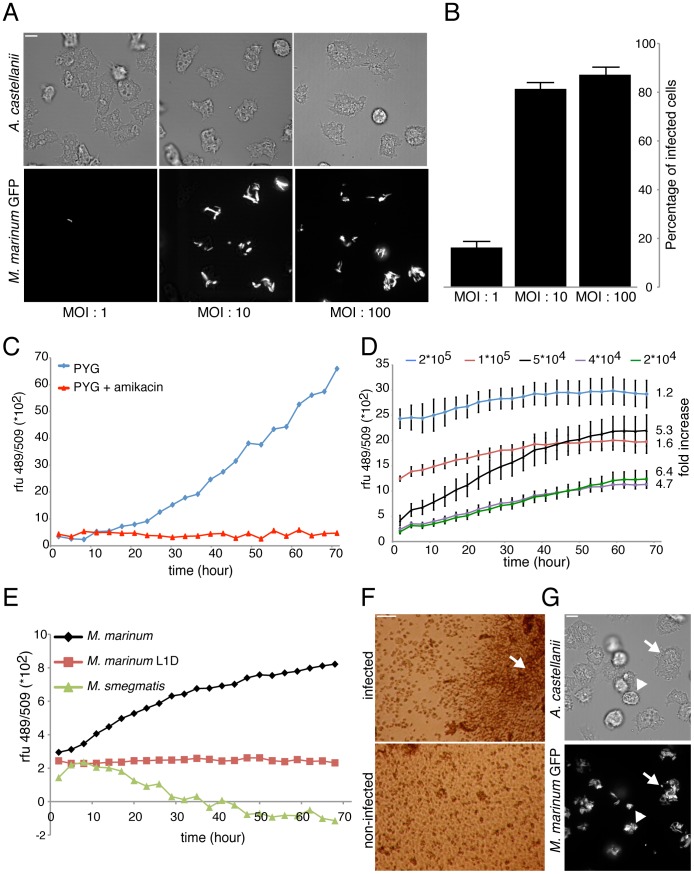
Figure 1. Mycobacteria infection of A. castellanii.
A. Confocal (top) and brightfield (bottom) pictures of A. castellanii infected with GFP-expressing M. marinum at different MOI. Scale bar, 10 µm. B. Corresponding percentage of infected cells under the three MOI conditions, error bars represent the standard deviation from technical replicates (three microscopy fields and at least forty counted cells) of one representative experiment. C. Growth kinetics of M. marinum msp12::GFP in PYG medium supplemented with 10 µM amikacin, representative experiment from a series with similar outcome. D. Growth kinetics of GFP-expressing M. marinum within A. castellanii plated at different densities, measured by total fluorescence intensity. The standard deviation derives from the technical mean of eight microwells. The values on the right represent the fold fluorescence increase between 2 and 68 hours post infection. E. Representative experiment of growth kinetics of GFP-expressing M. smegmatis, M. marinum WT and L1D mutant strains within A. castellanii, measured by fluorescence intensity. F. Brightfield microscopy of the cells at the bottom of a microwell. Infected cells at 3 DPI under control conditions and non-infected cells. Scale bar is 100 µm. G. Phase contrast (top) and confocal (bottom) pictures of A. castellanii infected cells with GFP-expressing M. marinum at three days post-infection. Infected giants cells (arrow), and some dead cells (arrowhead) are observed. Scale bar, 10 µm.

