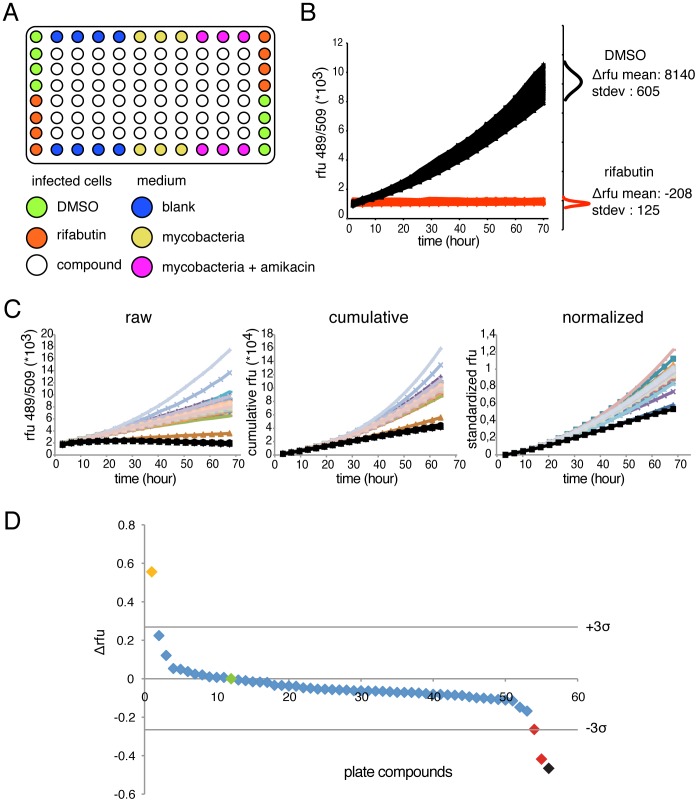
Figure 4. Screening protocol for anti-tubercular compounds.
A. Scheme of the plate design in 96-well format for compounds screening. B. Left, representative experiment of intracellular growth kinetic of GFP-expressing M. marinum measured by fluorescence intensity obtained from one control 96-well plates in presence of DMSO (N = 48) or 10 µM of rifabutin (N = 48). The small graphs on the right represent the normal distribution of the fluorescence difference between 2 and 72 hours of infection for DMSO and rifabutin. Consequently, the Z factor of this experiment was 0.74. C. For the statistical analysis, the data are treated in three steps. First, from the raw data, the value at 68 hours is subtracted from all others and a cumulative fluorescence curve is drawn. Then, the curves are normalized to the DMSO standard control. Graphs are representative of one experimental screening plate. D. Differential fluorescence values obtained from one experimental plate with diverse compounds are plotted. Horizontal bars represent 3-fold standard deviation from the DMSO mean. The green dot corresponds to the normalized DMSO controls; the orange dot to a putative pro-infectious compound; the black dot to the average of the rifabutin controls; the two red dots to two putative anti-infective compounds. The graph is representative of one experimental screening plate.

