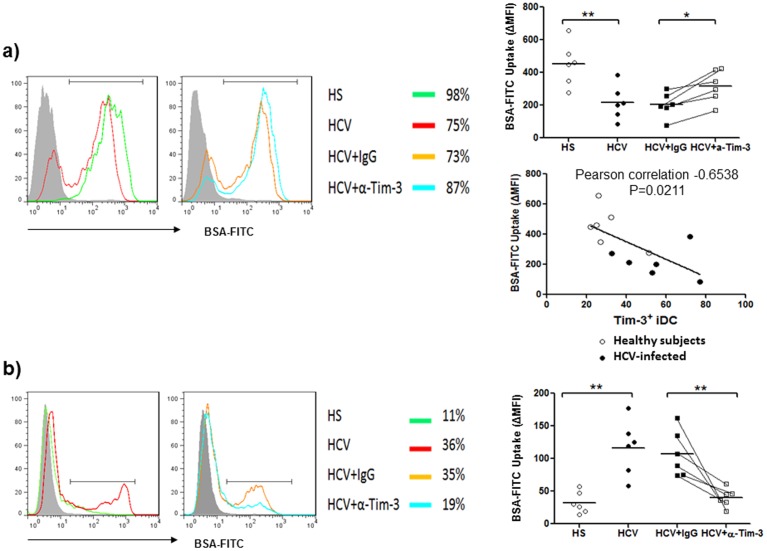
Figure 3. Tim-3-depedent antigen uptake by monocyte-derived DCs in HCV-infected and uninfected subjects.
a) Tim-3-dependent antigen uptake by monocyte-derived immature DC (iDC) in HCV-infected and uninfected individuals. M/MØ isolated from HCV-infected and HS were induced to iDC by stimulation with GM-CSF and IL-4 in the presence of anti-Tim-3 or control IgG antibodies for 5 days. The capacity of antigen phagocytosis by iDC was assessed by measuring iDC uptake of BSA-FITC by flow cytometry as described in the Methods. Data are shown as representative histograms of antigen-uptake DC in different subjects and treatments overlaid with isotype control in the grey-filled histogram (left), and the summary of corrected mean fluorescence intensity (ΔMFI) of iDC BSA-FITC uptake at 37°C and 4°C from multiple subjects (upper right); *P<0.05, **P<0.01. The relationship between antigen uptake and Tim-3 expression on iDC in various subjects was analyzed by Pearson correlation (middle right). Each symbol represents one subject, the mean value is shown and the same individual treated with control IgG or anti-Tim3 is line-connected. b) Tim-3-dependent antigen uptake by monocyte-derived mature DC (mDC) in HCV-infected and uninfected individuals. M/MØ isolated from 6 HCV-infected and 6 HS were induced to iDC by stimulation with GM-CSF and IL-4 in the presence of anti-Tim-3 or control IgG antibodies for 5 days, and further induced to mDC by Lm infection for additional 2 days in the presence of blocking or control antibodies. The capacity of antigen phagocytosis by mDC was carried out in the same way. Data are shown as the overlaid histograms with isotype control in the grey-filled histogram (left), the percentages of antigen-uptake cells in different subjects and treatments (middle), and the summaries of ΔMFI of BSA-FITC uptake by mDC from multiple subjects (right). Each symbol represents one subject; **P<0.01.

