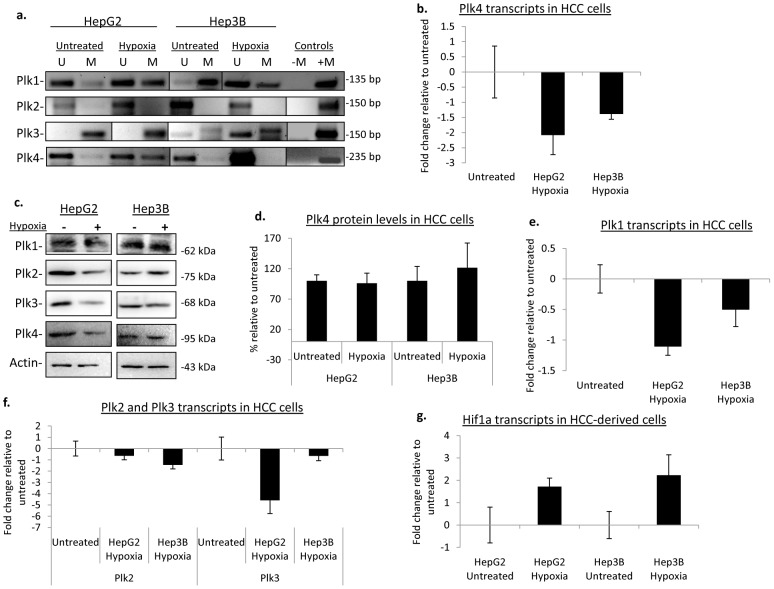
Figure 3. Hypoxia-induced modification of PLK promoter methylation in HCC cells.
(a) Promoter methylation status of the plks examined in HCC-derived cells HepG2 and Hep3B; U = unmethylated, M = methylated. Fully methylated HeLa DNA was used as a positive control (+M), no template was added to the negative control (−M). (b) Post hypoxia, PLK4 transcripts were assessed via qPCR in RNA extracted from HCC cells. All qPCR data is representative of the mean value of three independent experiments and error bars represent +/− SD. (c) PLK protein levels were examined post treatment from whole cell lysates. Actin was used as a loading control. (−) represents lysates from untreated cells, (+) lysates from cells grown in the presence of hypoxia. (d) Quantification of protein levels using densitometry. Levels have been normalized to the respective untreated controls. Data is representative of the mean value of three independent experiments and error bars represent +/− SD. (e) The fold change of PLK1 transcripts as determined by qPCR. Values normalized to the respective untreated sample. (f) PLK2 and PLK3 analyzed and fold changed determine by normalization to the respective untreated samples. (g) Hif1α transcripts post hypoxia were determine by real-time PCR using a Taqman probe.

