Figure 2.
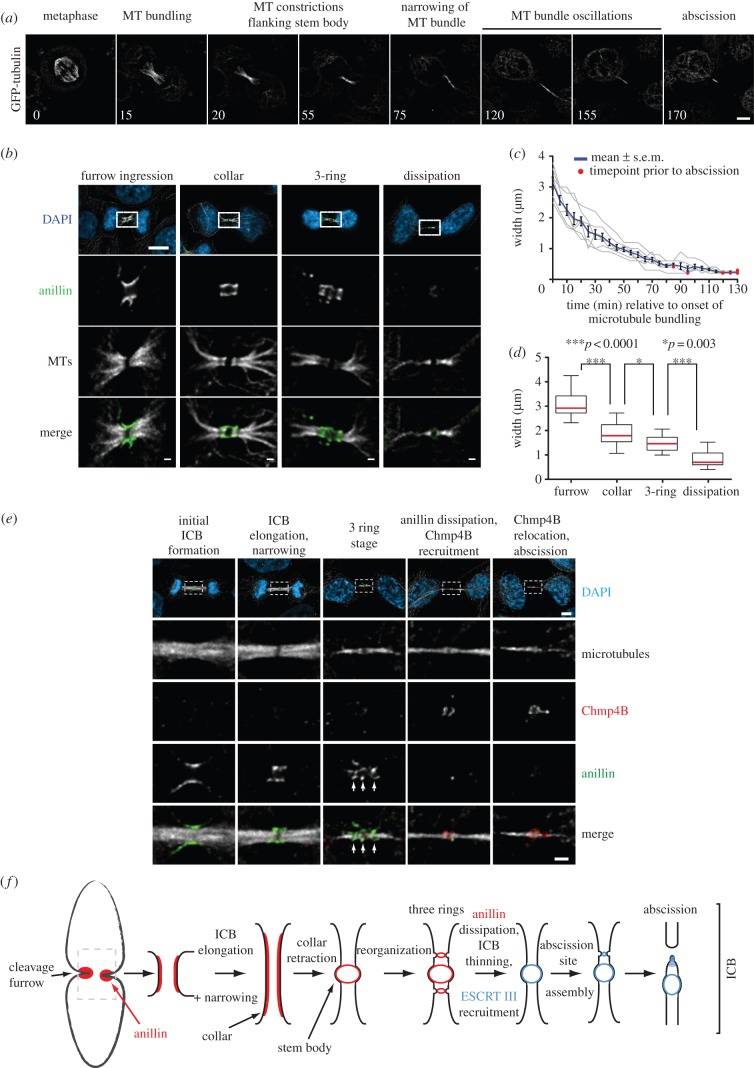
The ICB forms through a series of defined organizational states. (a) Micrographs from a time-lapse series taken of HeLa cells expressing GFP-tubulin from the point of entry into anaphase through to abscission. Numbers are minutes from the onset of anaphase. Scale bar, 5 μm. (b) Micrographs of fixed HeLa cells stained with anti-anillin and anti-tubulin antibodies. Scale bar, 5 μm in whole cell images and 1 μm in magnified images. (c) Measurement of the width of the microtubule bundle in the ICB overtime. Grey lines are traces from individual cells, the blue line the average. (d) ICB microtubule width during different anillin organization states. Furrow, n = 17, collar, n = 28, three-ring, n = 15 and dissipation, n = 38. Red line is the median and the boxes mark the 25th–75th percentile range. (e) Stably expressing GFP-tubulin HeLa cells were fixed and stained with anti-anillin and anti-Chmp4B antibodies. The organizational state of GFP-microtubules in fixed cells was compared with that observed in live imaging, (b), to order the ICBs in increasing states of maturity from left to right. White arrows point to the three anillin rings. Scale bar, 5 μm in whole cell images and 1 μm in magnified images. (f) Schematic outlining the different stages of anillin (red) and ESCRT III (blue) organization during cytokinesis. MT, microtubule.

