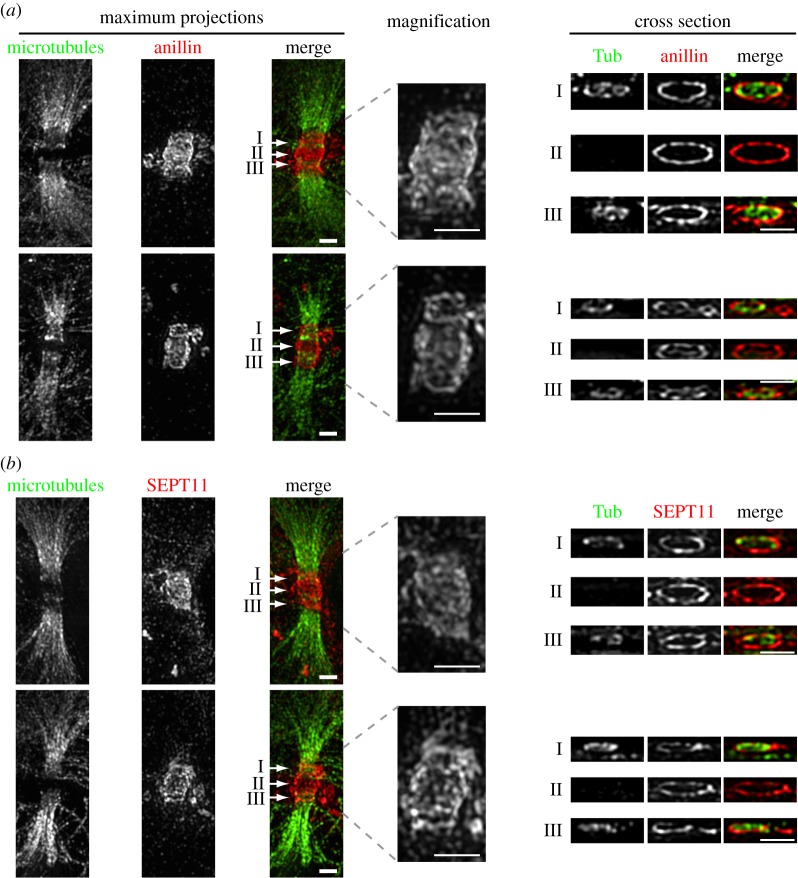
Figure 4.
Subdiffraction microscopy images of anillin and septin organization in ICB during their elongation phase. (a) TCA fixed Hela cells stained with anti-tubulin (Tub) and anti-anillin antibodies. Left-hand panels are maximum projections, right-hand panels are cross section though different points of the ICB marked I, II and III. Scale bar, 1 μm. (b) TCA fixed HeLa cells stained with anti-tubulin and anti-SEPT 11 antibodies. Left-hand panels are maximum projections, right-hand panels are cross section though different points of the ICB marked I, II and III. Scale bar, 1 μm.

