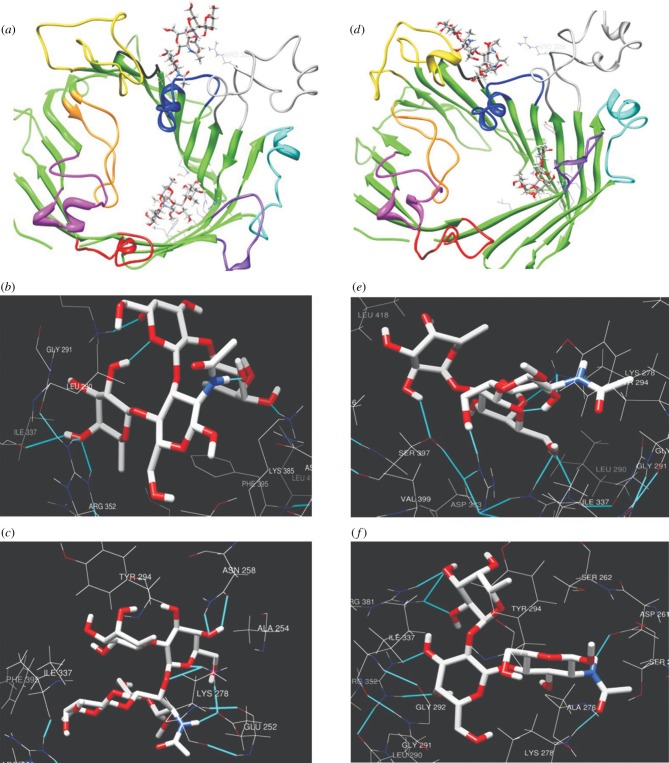
Figure 7.
Influence of glycosylation on conformational changes induced by ligand binding. A stereo cartoon of the MOMP backbone viewed from the extracellular side is presented. Regions are shown in the following colours: green (β strands); red (L1); magenta (L2); orange (L3); yellow (L4); black (L5); blue (L6); grey (L7); cyan (L8); purple (L9). The complexes are with Leb (a) and H-II (d). In addition, hydrogen bonds shown in light blue correspond to amino acids residues, which are putatively involved in the interactions of glycosylated MOMP (b and e) and its non-glycosylated form (c and f) with Leb and H-II, respectively, in their active sites.

