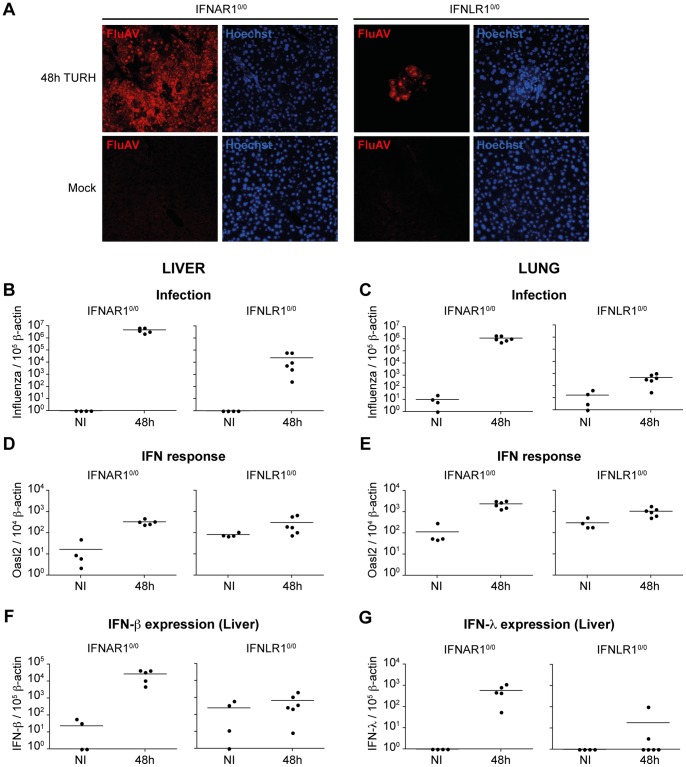
Figure 2. IFN response in mice infected with the TURH influenza A virus strain.
A: Immunofluorescence detection of TURH influenza A virus in liver sections from Mx-IFNAR10/0 and Mx-IFNLR10/0 mice infected for 48 hours or mock-infected, using anti-influenza A virus antibody (Red) and Hoechst staining of nuclei (blue). Results are representative of two independent experiments. B–C: RT-qPCR analysis of influenza A virus replication in the liver (B) and lungs (C) of Mx-IFNAR10/0 and Mx-IFNLR10/0 mice. Results are expressed as influenza A virus cDNA copies per 105 copies of β-actin cDNA. D–E: RT-qPCR analysis of Oasl2 expression in the liver (D) and lungs (E) of Mx-IFNAR10/0 and Mx-IFNLR10/0 infected mice. Results are expressed as mOasl2 cDNA copies per 103 copies of β-actin cDNA. F–G: IFN-β (F) and IFN-λ (G) production in the liver of infected mice. Results are expressed as IFN cDNA copies per 105 copies of β-actin cDNA. It is noteworthy that cells from IFNAR10/0 expressed lower basal levels of IFN, likely as a consequence of a disrupted positive feed-back loop for IFN expression in these mice.

