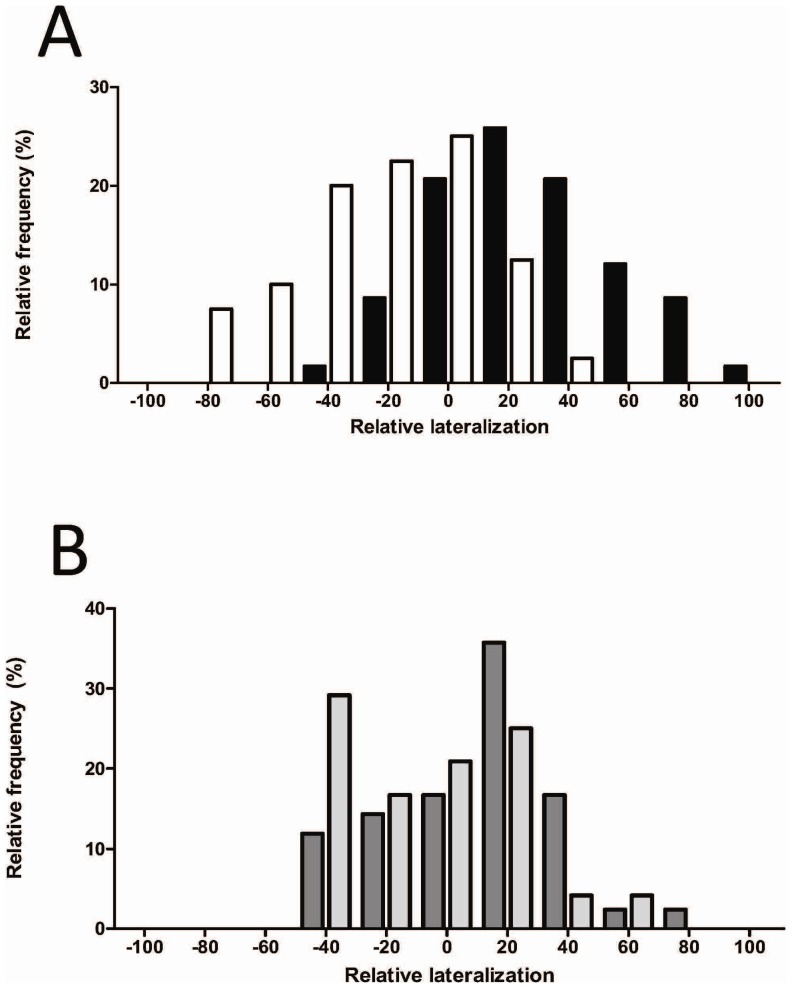
Figure 3. Relative frequency distributions of L R in C-CO2/C-Temp (black bars) and E-CO2/C-Temp (white bars) (A) and in C-CO2/E-Temp (dark grey bars) and E-CO2/E-Temp (light grey bars) (B).
Positive and negative values indicate right and left turns, respectively. The extreme values of |100| indicate fish that turned in the same direction on all 10 trials.

