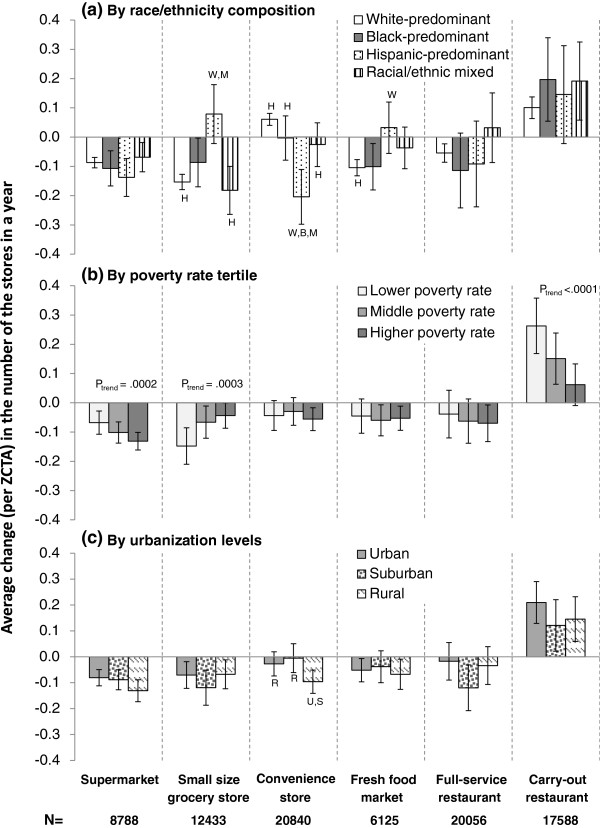
Figure 1.
Changes of food stores/services number in places having the store/service at baseline, by a) race/ethnicity composition, b) poverty rate, c) urbanization level. 1. Adjusted for local total population, poverty rate,% of foreign born population, urbanization categories, total business size in 2000, the change in business size from 2000 to 2001, and census region. 2. N: number of ZCTA5 areas where the food store of analysis existed in the baseline year. 3. Pairs of characters indicate significant (p < 0.005 to account for multiple pair-wise comparisons) difference from the denoted areas: W, B, H, M indicate different from White-, Black-, Hispanic-predominant and Mixed race/ethnicity areas; R, S, U indicate significant difference from rural, suburban or urban areas. 4. Types of food outlets for the six panels are listed at the bottom of the figure: (from left to right) supermarket, small size grocery store, convenience store, fresh food market, full-service restaurant, carry-out restaurant.

