
Figure 4.
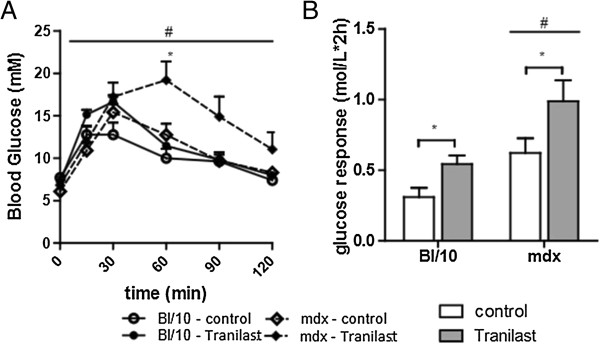
Tranilast treatment effects on glucose tolerance in mdx mice. Glucose tolerance tests were performed on vehicle and tranilast-treated control and mdx mice during the final week of treatment. Changes in blood glucose over time during the glucose tolerance test (A) and calculated glucose response (B; area under the curve). #P < 0.05 group main effect, mdx vs. control. *P < 0.05 treatment main effect.