Figure 2.

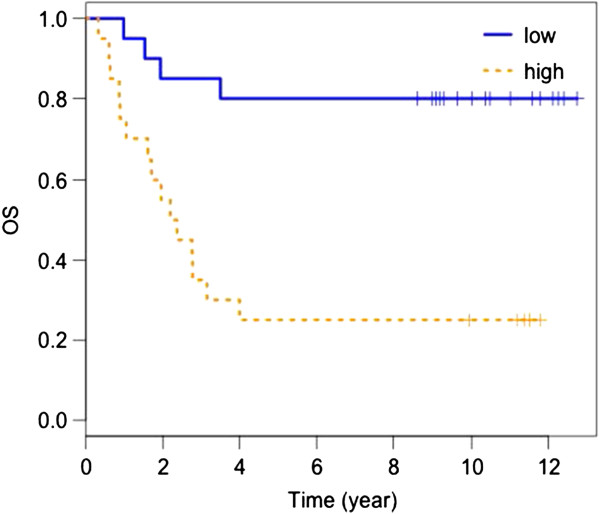
Kaplan-Meier plot of overall survival by baseline TGF-α, TNF-RII, TIMP-1, CRP (Cox PH model score). High serum levels correlate with worse prognosis.

Kaplan-Meier plot of overall survival by baseline TGF-α, TNF-RII, TIMP-1, CRP (Cox PH model score). High serum levels correlate with worse prognosis.