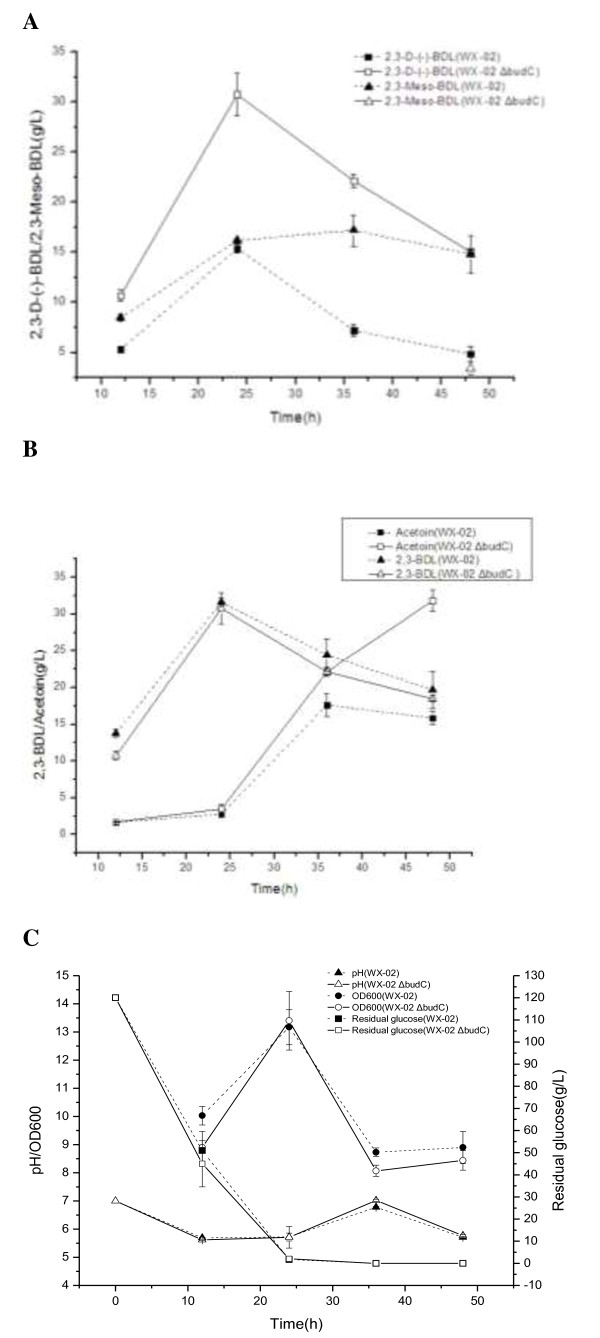
Figure 6.
Comparison of metabolites production, cell growth, and glucose consumption profile by wild-type (WX-02) and budC knock-out (WX-02 ΔbudC) B. licheniformis strains. (A)D- and meso-2,3-butanediol production. (B) Total 2,3-butanediol and acetoin production. (C) Cell density, medium pH, and residual glucose concentration. Data are expressed as mean ± standard errors of three replicates. BDL, butanediol.

