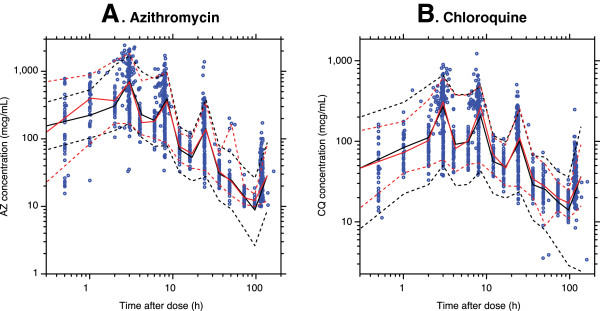
Figure 3.

Visual predictive check for all concentration-time data for (A) serum azithromycin (AZ) and (B) plasma chloroquine (CQ). Figure 3 shows the log-log plot of the visual predictive check for the final pharmacokinetic model using all data in the dataset. Open blue circles are observed concentrations. The solid black line represents the median of the predicted data (black dashed lines represent the 95% confidence interval [CI]). The solid red line represents the median of the actual data (red dashed lines represent the 95% CI). No apparent bias was noted in the final model and overall performance was considered adequate.
