Figure 4.

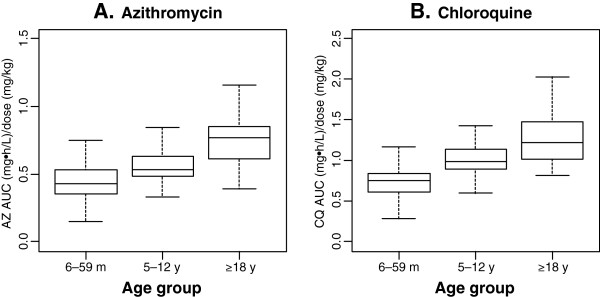
Comparison of dose-normalized area under the concentration-time curve (AUC inf ) by age group for (A) serum azithromycin (AZ) and (B) plasma chloroquine (CQ).

Comparison of dose-normalized area under the concentration-time curve (AUC inf ) by age group for (A) serum azithromycin (AZ) and (B) plasma chloroquine (CQ).