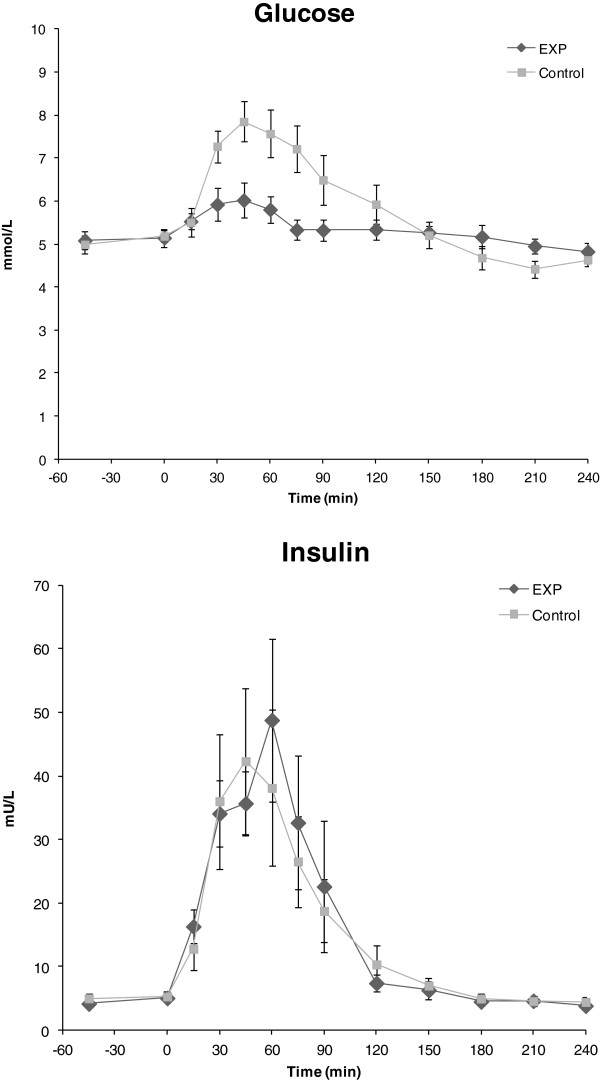
Figure 4.
Plasma glucose and insulin. Plasma concentrations (means ± SEM) of glucose and insulin before and after ingestion (at T = 0) of the study products EXP (n = 9) and Control (n = 10). Baseline values were not different between groups. Peak glucose (P < 0.001) and glucose iAUC (P = 0.003) was significantly higher after ingestion of Control, but groups did not differ significantly in peak or iAUC insulin.

