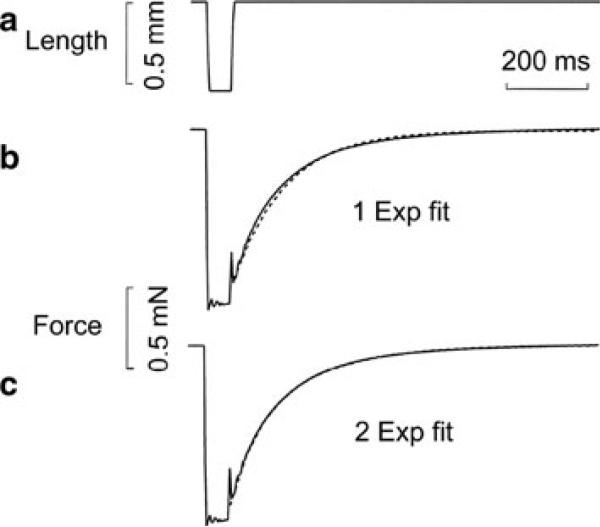
Fig. 2.
Length (in a) and tension (in b and c) time courses. A rabbit psoas single muscle fibre was activated in the standard activating solution at 20 °C. When the tension plateau was reached, the length was suddenly released by 20 % L0 and restretched to L0 after 50 ms. The solid lines are the actual record, and the dotted lines are exponential fits (one exponential fit in b, and two exponential fit in c) with the following parameters: b kTR = 8 s–1, A = 0.93 mN; c kTR(slow) = 5.7 s–1, Aslow = 0.58 mN, kTR(fast) = 16.3 s–1, Afast = 0.42 mN; where kTR is the rate constant and A is its amplitude

