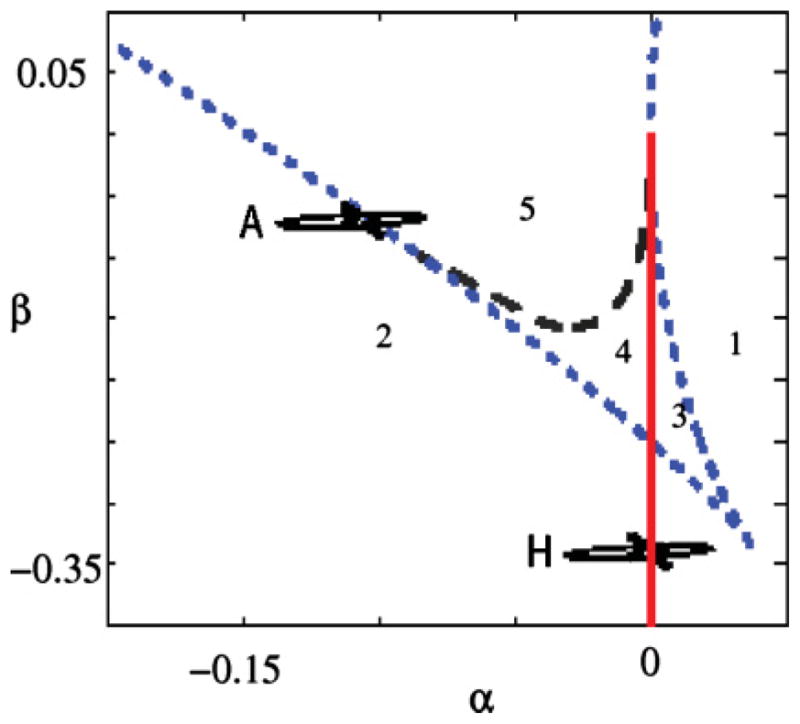
FIG. 4.

(Color online). Bifurcation diagram of the standard system described by Eqs. (8). The dynamical regimes that are necessary in our description are present in these equations. The numbers in the diagram represent the different dynamical regimes and are equivalent to the ones described in Fig. 1. The dashed black line indicates a homoclinic bifurcation, the dotted blue line a saddle-node bifurcation, and the full red line a Hopf bifurcation. The parameters in this problem are α and β, the unfolding parameters of a cubic Takens Bogdanov bifurcation. Increasing ps (k) in the diagram of Fig. 1 corresponds to decreasing α (β) in this figure.
