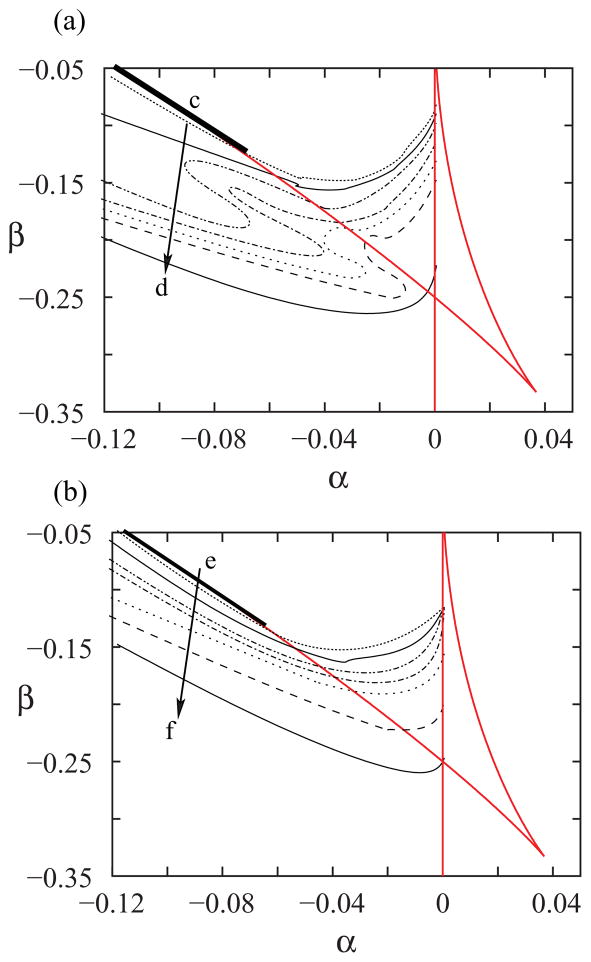
FIG. 5.
(Color online). The level curves for SCI (a) and fundamental frequency (b) for the dynamical system defined by Eqs. (8). For each pair of values of α and β, numerical integrations of the dynamical model were computed, and the SCI and fundamental frequency of the solutions were found. In (a) we display a discrete set of curves. Along each one, the SCI is constant. The same is shown in (b), but the computed acoustic feature extracted from the numerical simulation is its fundamental frequency. The arrows from c to d in (a), and from e to f in (b) denote the directions along which the numerical values increase. In (a), the SCI goes from SCI = 3.5 to SCI = 1.1 for the curves displayed. In (b), the fundamental frequencies of the isofundamental frequency curves take values from 750 to 1900 Hz. The full lines in (a) and (b) represent the bifurcation diagram of the normal form. The thicker full lines stand for the lines where the SNILC bifurcations take place.

