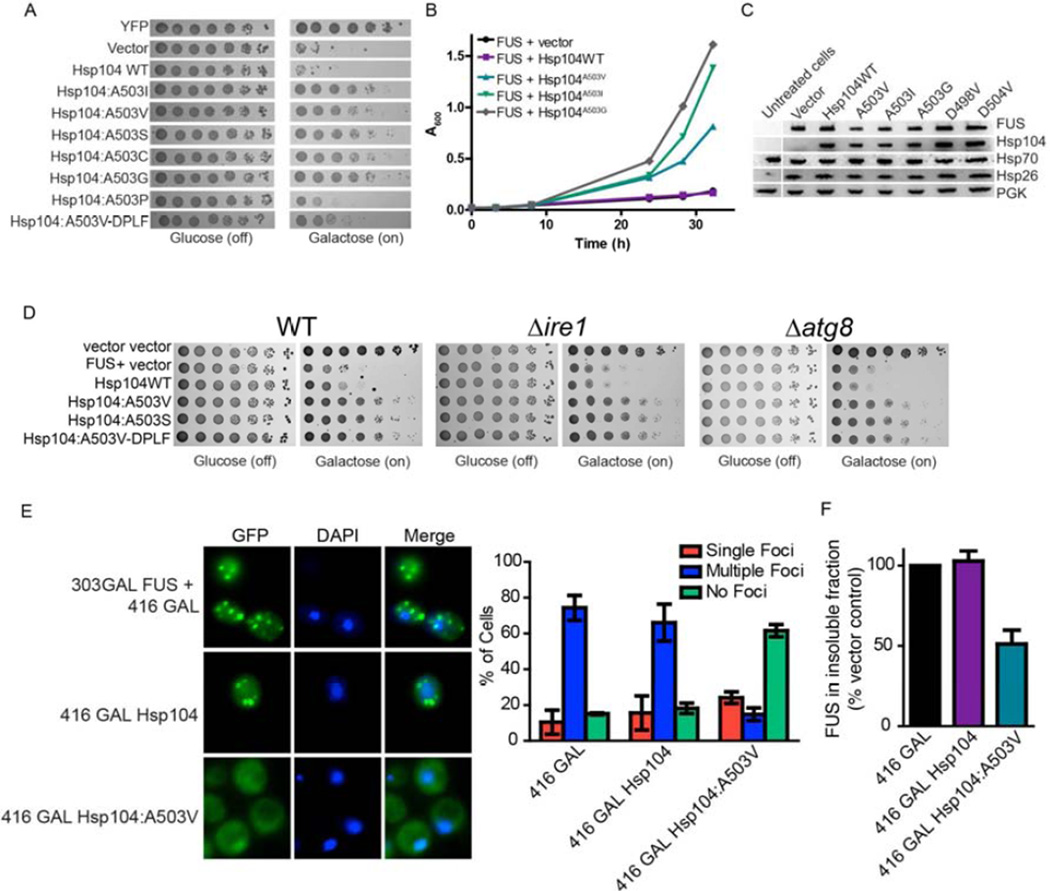
Figure 3. Hsp104A503X variants suppress FUS toxicity and aggregation.
(A) Δhsp104 yeast transformed with FUS and the Hsp104 variants, or YFP and vector, were serially diluted fivefold and spotted onto glucose (off) or galactose (on). (B) Selected strains from (A) were induced in liquid and growth was monitored by A600nm. (C) Strains from (B) were induced for 5h, lysed, and immunoblotted. (D) WT, Δire1, or Δatg8 yeast were co-transformed with vector control, or FUS plus vector, or the indicated Hsp104 variant and were serially diluted fivefold and spotted onto glucose (off) or galactose (on). (E) Fluorescence microscopy of cells co-expressing FUS-GFP and Hsp104WT, Hsp104A503V, or vector. Cells were stained with Hoechst dye to visualize nuclei (blue). FUS aggregation was quantified by counting the number of cells containing 0, 1, or more than 1 foci. Values represent means±SEM (n=3). (F) Δhsp104 yeast co-transformed with FUS and vector or the indicated Hsp104 variant were induced with galactose for 5h at 30°C, lysed and processed for sedimentation analysis and quantitative immunoblot. The relative amount of insoluble FUS was determined as a % of the vector control. Values represent means±SEM (n=2).
See also Fig. S3 and S4.

