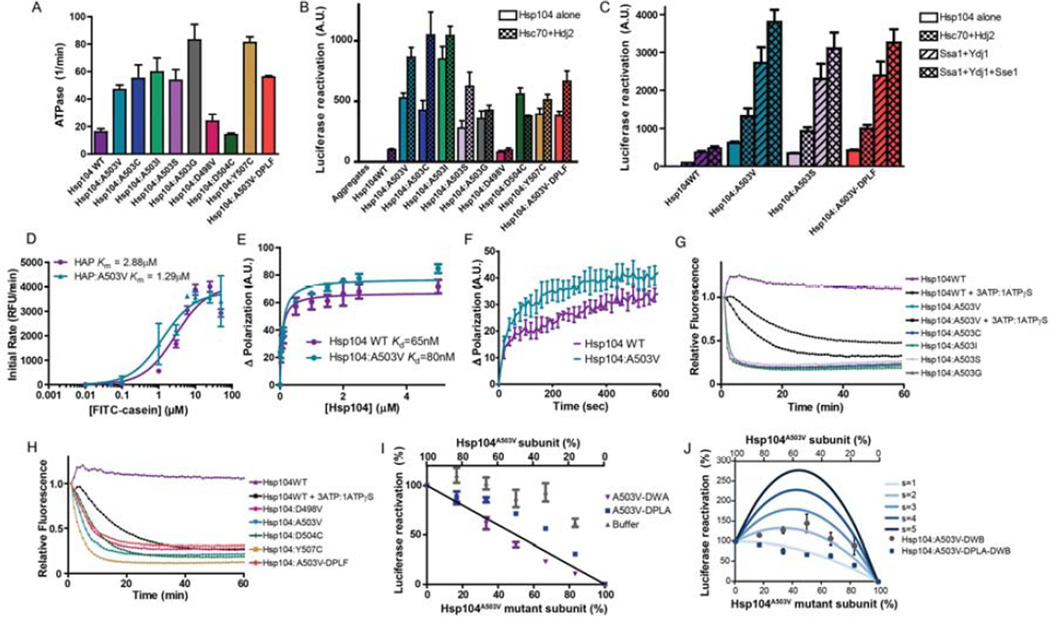
Figure 6. Potentiated Hsp104 variants are tuned differently than Hsp104WT.
(A) ATPase activity of Hsp104 variants. Values represent means±SEM (n=3). (B) Luciferase aggregates were incubated with Hsp104 variant plus (checkered bars) or minus (clear bars) Hsc70 (0.167µM) and Hdj2 (0.167µM). Values represent means±SEM (n=3) (C) Luciferase aggregates were incubated with Hsp104 variant plus or minus: Hsc70 (0.167µM) and Hdj2 (0.073µM); Ssa1 and Ydj1; or Ssa1, Ydj1, and Sse1. Values represent means±SEM (n=3). (D) Increasing concentrations of FITC-casein were incubated with ClpP plus HAPWT or HAPA503V. Initial degradation rates were plotted against FITC-casein concentration to determine Km. Values represent means±SEM (n=3). (E) FITC-casein was incubated with increasing concentrations of Hsp104WT or Hsp104A503V. Change in fluorescence polarization was plotted against Hsp104 concentration to determine Kd. Values represent means±SEM (n=3). (F) Kinetics of Hsp104WT (1µM) or Hsp104A503V (1µM) binding to FITC-casein (0.1µM) assessed by fluorescence polarization. Values represent means±SEM (n=3). (G, H) RepA1–70-GFP was incubated with Hsp104 variant and GroELtrap plus ATP or ATP:ATPγS (3:1). GFP unfolding was measured by fluorescence. Representative data are shown. (I) Buffer, Hsp104A503V-DWA, or Hsp104A503V-DPLA was mixed in varying ratios with Hsp104A503V to create heterohexamer ensembles and luciferase disaggregase activity was assessed. Values represent means±SEM (n=3). Black line denotes the theoretical curve of a probabilistic mechanism where only a single WT subunit is required for disaggregation. (J) Experiments were performed as in (I) for Hsp104A503V-DWB and Hsp104A503VDPLA-DWB. Theoretical curves are shown wherein adjacent pairs of A503V:A503V or A503V:mutant subunits confer hexamer activity, while adjacent mutant subunits have no activity. Each adjacent A503V:A503V pair has an activity of 1/6. Adjacent A503V:mutant pairs have a stimulated activity (s), and the effect of various s values are depicted. Values represent means±SEM (n=3).

