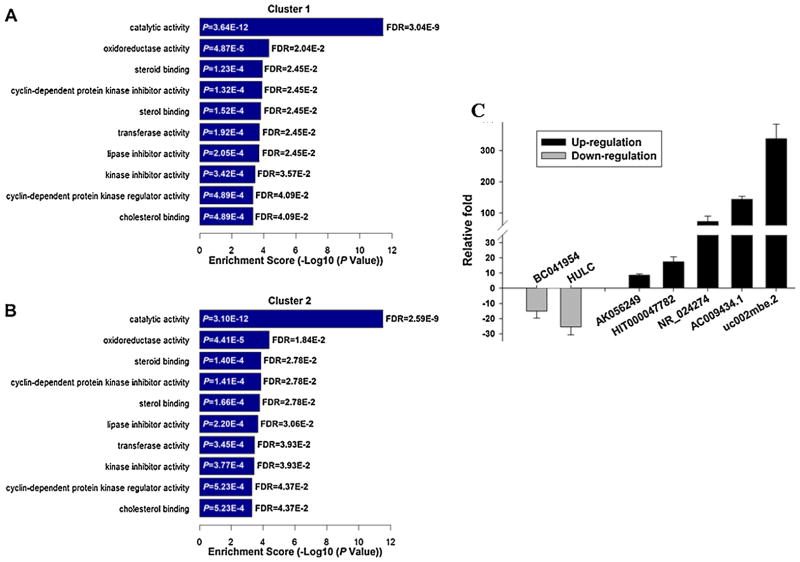
Fig. 4.
Gene Oncology analysis of lncRNAs-associated with coding genes.
(A) GO analysis of coding genes in which one coding gene is connected to at least three lncRNAs. (B) GO analysis of coding genes in which an lncRNA is connected to at least three mRNAs. The top ten significantly enriched molecular functions along with their scores are listed as the x-axis and the y-axis, respectively, in both (A) and (B). (C) The microarray data was further confirmed by real-time PCR. LncRNA expression level was normalized to the level of GAPDH mRNA. The data shown were relative fold induction (TSA vs. DMSO treatment) at 24 h treatment. Each column represents fold change between TSA and DMSO treated groups with standard error. This experiment was repeated three times.

