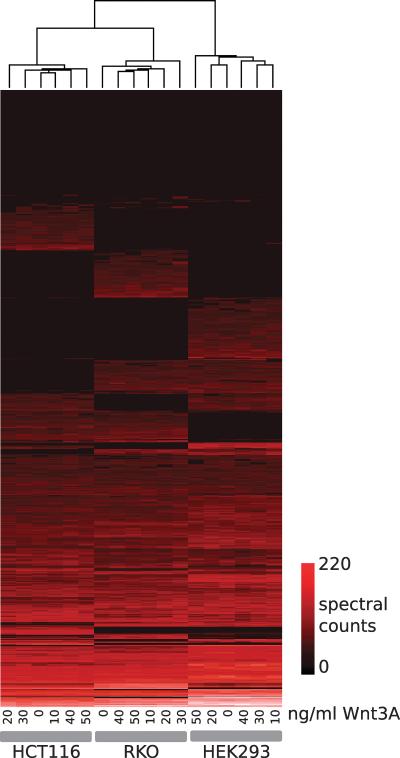
Figure 3.
Clustered heat map for the Wnt protein expression study. For each sample, spectral counts (Normalized Spectral Abundance Factors) were computed for all proteins. The complete dataset was hierarchically clustered (Euclidean distance, UPGMA) and represented as a heat map as shown. Sample dendrogram is shown at the top of the figure; the protein dendrogram has been omitted for clarity. Samples cluster according to cell-line, and distinct cell-line specific profiles are visible. As colorectal cancer derivatives, samples from the HCT116 and RKO cell lines are more similar to one another than to HEK293 samples.

