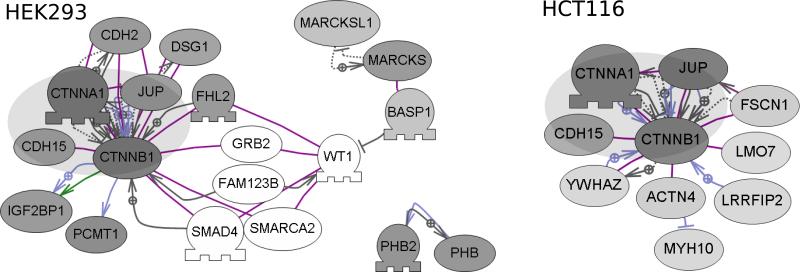
Figure 6.
Comparative analysis of β-catenin associated proteins in HEK293 and HCT116 cells. Sub-network analysis (Pathway Studio) was performed on the sets of specific interactors from anti- β-catenin AP-MS experiments. The most significant connected components are shown for each cell-line. A common core of proteins (represented by the large gray oval) was detected as present in each cell line, whereas other proteins, either known or not known as β-catenin interactors were unique. The shade of each protein node represents the specificity of detection (the ratio of anti- β-catenin affinity-purifications / control purifications). Darker shaded nodes represent proteins with higher ratios. Non-shaded/White nodes represent proteins not detected in the AP-MS experiments, but included in the figure as potential network components.

