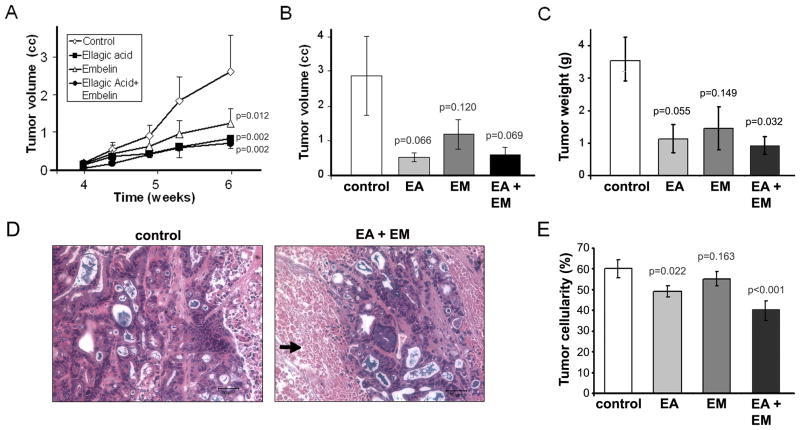
Figure 7. Ellagic acid alone or in combination with embelin significantly reduces pancreatic tumor volume in a mouse xenograft model.
Inhibition of HAPF-II s.c. tumor growth was measured in mice fed diets supplemented with ellagic acid (EA), embelin (EM), or a combination of ellagic acid and embelin (EA+EM). Mice fed standard diet without phytochemical supplementation were used as controls. Diets started one week before implantation of tumor cells and continued for 5 weeks more. Mice were sacrificed at the end of the 6-week period due to large tumors in most control mice. Values in graphs (panels A, B, C, and E) represent mean ± SEM; n= 4–6. For A, p-values are for one-sided tests comparing the slopes of the treatment groups to the slope of the controls. For B, C and E, p values are for one-sided two-sample t-tests comparing with controls. The synergistic effects (defined similar to Fig. 3) were tested. With Bonferroni’s adjustment, p<0.0125 is considered statistically significant. (A) Graph illustrates tumor growth during the last two weeks. Values show external tumor volume measured two times per week (mean ± SEM; n= 6). Compared to controls, tumor growth was significantly reduced in mice fed diets supplemented with ellagic acid (p=0.002), embelin (p=0.012) or a combination of ellagic acid and embelin (p=0.002). No synergistic effects were found between ellagic acid and embelin (p=0.959). (B) Graph shows internal tumor volume at sacrifice (6 weeks on diets). Tumor volume at sacrifice was reduced in mice on ellagic and/or embelin diets but the differences compared to controls did not reach statistical significance (P<.05). No synergistic effects were found between ellagic acid and embelin (p=0.955). (C) Tumor weight at sacrifice was reduced in mice on ellagic and/or embelin diets but the differences compared to controls only reach statistical significance (P<.05) in mice fed a combination of ellagic acid and embelin (P=0.03). No synergistic effects were found between ellagic acid and embelin (p=0.546). (D) Representative H&E staining in tumor tissue sections from mice fed for 6 weeks control diet or diet supplemented with ellagic acid and embelin. Pictures were taken from the center of the tumor. Compared to controls, tumors in mice fed EA+EM displayed extensive areas with low cellularity (black arrow). Bars, 50 μm. (D) Tumor cellularity was measured in H&E stained tumor tissue sections by morphometric analysis of the total area occupied by tumor cells. Graphs show mean ± SEM of values obtained in at least 10 randomly selected histological sections per mouse; data obtained from 3 mice per group were analyzed. As indicated in the figure, cellularity within the tumor significantly decreased in mice fed diets supplemented with ellagic acid (p=0.022) alone or in combination with embelin (p<0.001). No synergistic effects were found between ellagic acid and embelin (p=0.319).

