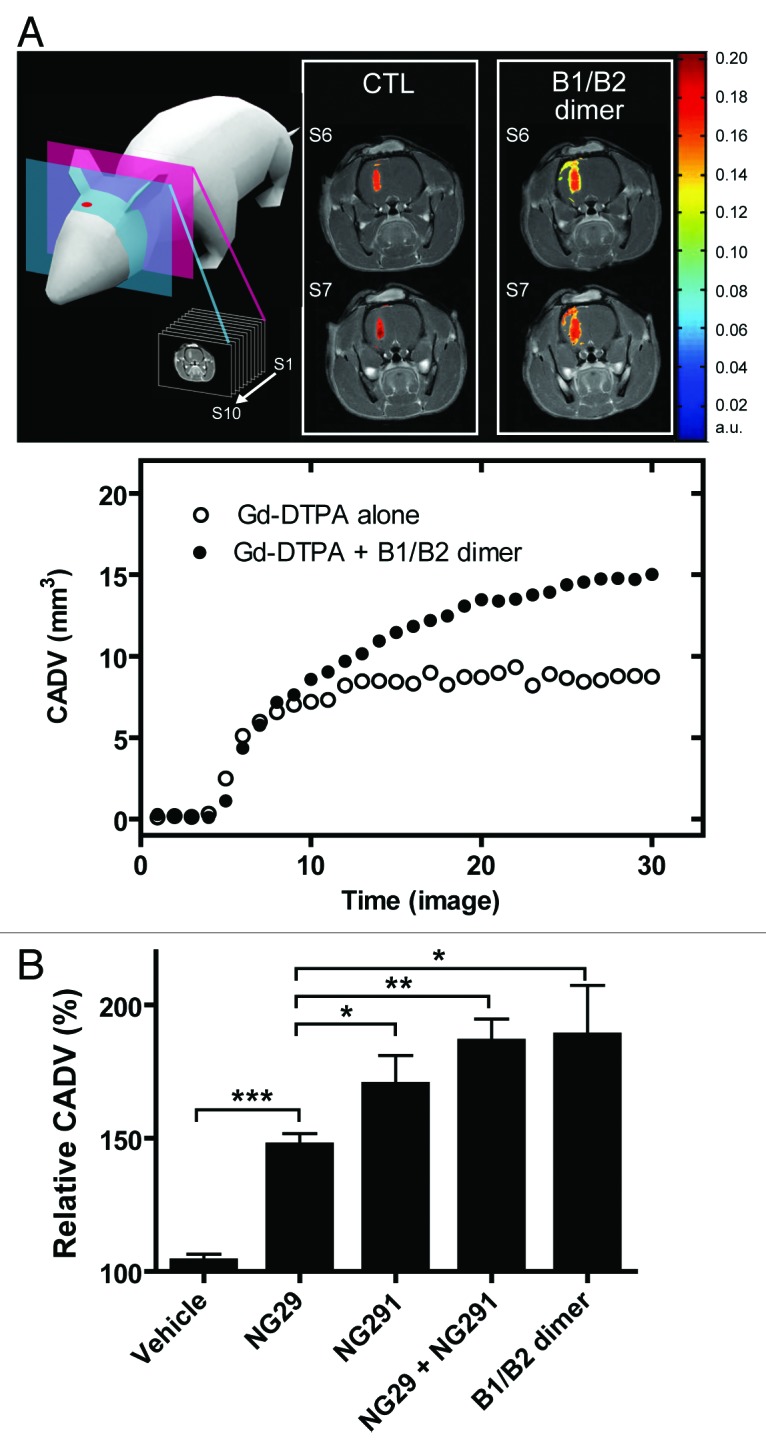
Figure 2. Comparison of contrast-agent distribution and uptake in the brain following intraarterial administration of B1R and B2R agonists. Brain tumors were induced by intracranial injection of 1 × 10⁴ F98 glioma cells on day 0. MRI experiments were performed 10 d after tumor transplantation; whole set of acquired images consisted of 10 axial, contiguous slices with a thickness equal to 1.5 mm. The schematic diagram shows MRI slices in which measurements were taken. (A) Representative axial Gd-DTPA-enhanced T1-weighted MR images depicting the brain of an F98-implanted rat before and after intracarotid B1R/B2R dimer agonist treatment (50 nmol/kg/min for 5 min). Regions of contrast enhancement related to Gd-DTPA are highlighted in pseudo-colors. Contrast agent distribution volume (CADV) as a function of time calculated from the corresponding set of images (bottom panel). (B) Relative CADV in percent determined following the infusion of the vehicle (saline), B1R agonist NG29, B2R agonist NG291, NG29+NG291, or B1R/B2R dimer agonist. Agonists were given at the dose of 50 nmol/kg/min for 5 min (i.c.). Each bar represents the mean ± SEM for 4 to 6 animals. The differences between treatment groups were examined using the Student unpaired t test. *Statistical significance (P < 0.05). Methods of these experiments based on MRI are presented elsewhere.6,7
