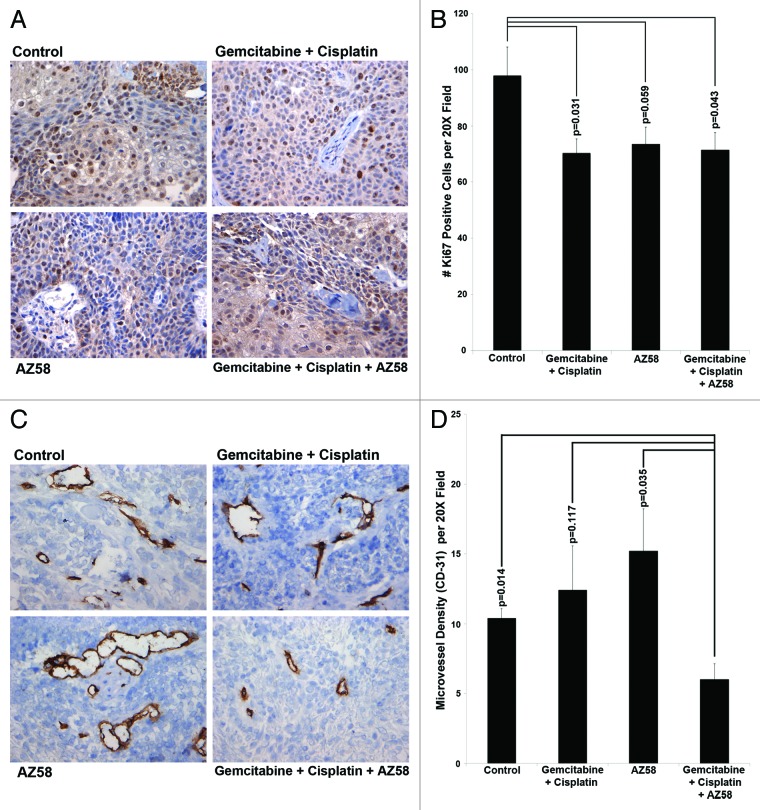
Figure 6. AZ58, in combination with chemotherapy, functions through decreased cellular proliferation and decreased microvessel density. (A) Immunohistochemistry with Ki-67 is displayed. Imaging was performed at 20 × magnification. Representative images are shown. (B) Positive Ki-67 nuclei were counted, averaged, and plotted on a bar graph. Error bars represent standard error. P values were calculated compared with the control condition. n = 10 images per treatment condition. (C) Immunohistochemistry using an antibody for CD-31 is displayed. Imaging was performed at 20 × magnification. Representative images are shown. (D) Positive foci of CD-31 were counted, averaged, and plotted on a bar graph. Error bars represent standard error. P values were calculated compared with the combination condition. n = 5 per treatment condition.

An official website of the United States government
Here's how you know
Official websites use .gov
A
.gov website belongs to an official
government organization in the United States.
Secure .gov websites use HTTPS
A lock (
) or https:// means you've safely
connected to the .gov website. Share sensitive
information only on official, secure websites.
