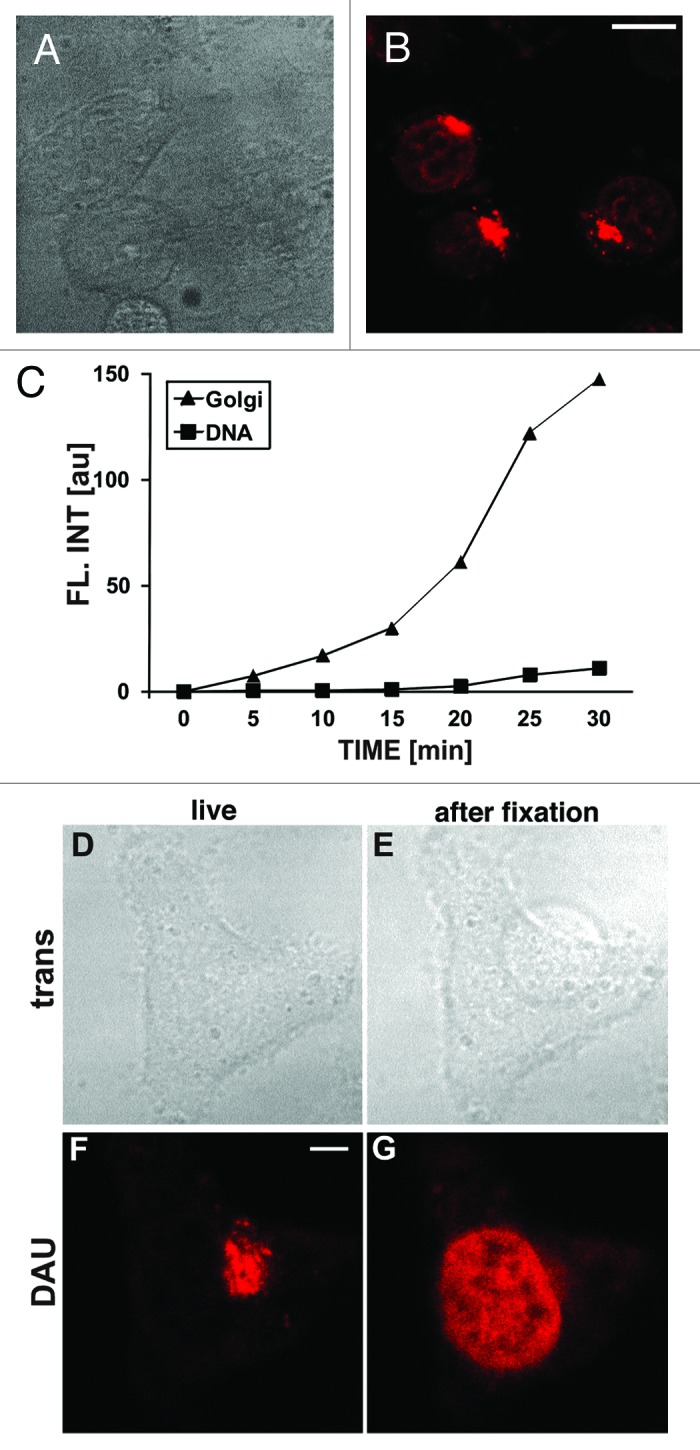
Figure 1. Entry and subcellular localization of daunomycin in live HeLa cells. (A and B) Transmitted light and fluorescence images showing a cell in medium supplemented with daunomycin (500 nM; 30 min); scale bar 10 μm. (C) The intensities of fluorescence of daunomycin accumulating in the region of the Golgi apparatus and in chromatin. (D−G) Images of a live cell exposed to daunomycin for 30 min and the same cell after formaldehyde fixation. Daunomycin is released from intracellular vesicles and Golgi apparatus upon fixation; thus flow cytometry of fixed cells detects only the DNA-bound drug (see below). (D and E) Transmitted light images; (F and G) Fluorescence (the detection level in [F and G] is the same), scale bar 5 μm.
