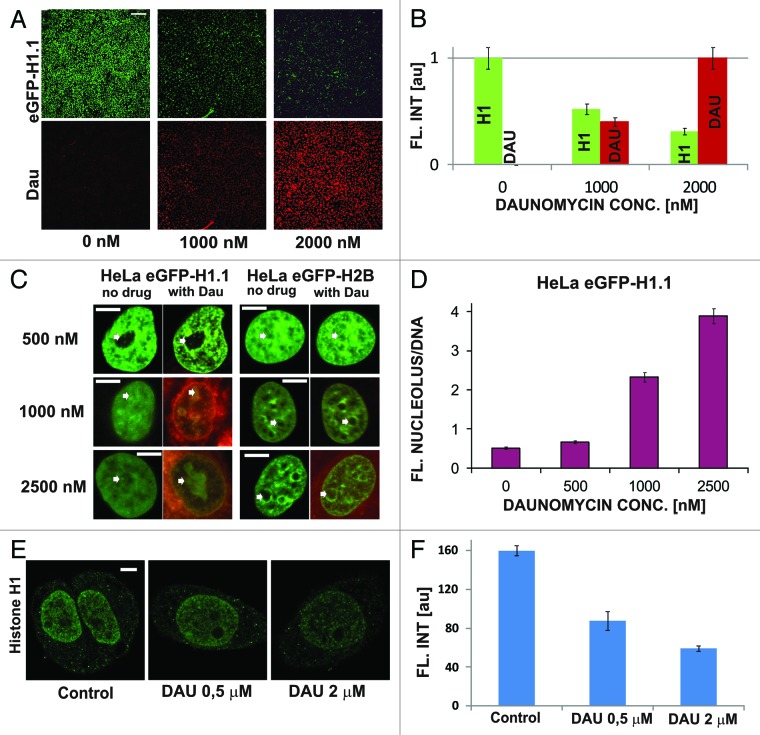
Figure 2. Dissociation of H1.1 linker histones from DNA and translocation to nucleoli upon exposure to daunomycin. (A and B) Images and a graph showing a decrease of the intensity of green fluorescence of GFP-H1.1 after a 2 h exposure of live HeLa cells to daunomycin (1 or 2 μM); scale bar 100 μm. (C) Images of histone GFP-H1.1, GFP-H2B, and daunomycin (0.5, 1, and 2 μM) in live cells. As the drug binds to DNA, chromatin aggregates and histones H1.1 but not H2B accumulate in nucleoli (arrows). (D) A ratio between the intensities fluorescence of GFP-H1.1 histones bound in nucleoli and to DNA outside of the nucleoli. At higher drug concentrations more histone H1.1 is translocated to nucleoli and the intensity of the nucleolar fluorescence of daunomycin exceeds that of chromatin by a factor of almost 4. (E and F) Dissociation of histone H1 from DNA in cells exposed to daunomycin, detected by immunofluorescence. Images and a graph showing the average fluorescence intensity of immunolabeled H1.1 histone detected in nuclei of untreated cells and in the treated cells, following fixation. The H1 histone, which dissociated from DNA, is washed out during the immunofluorescence procedure and escapes detection by this method, but the process can be observed directly under a microscope (data not shown); scale bar 5 μm.

An official website of the United States government
Here's how you know
Official websites use .gov
A
.gov website belongs to an official
government organization in the United States.
Secure .gov websites use HTTPS
A lock (
) or https:// means you've safely
connected to the .gov website. Share sensitive
information only on official, secure websites.
