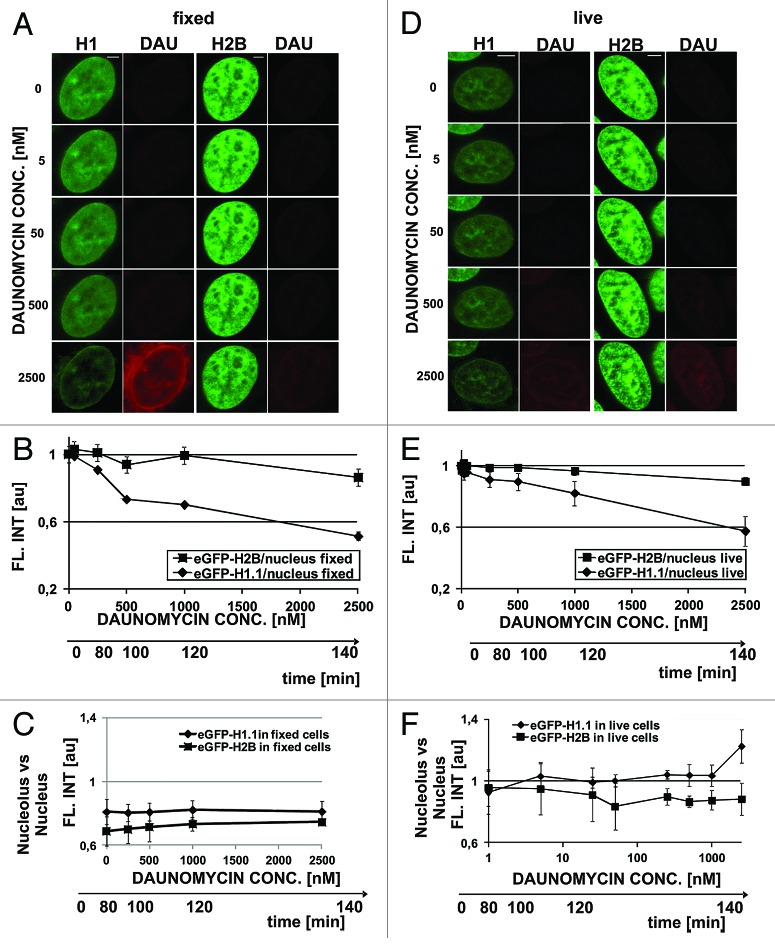
Figure 3. Dissociation of H1.1 histones and changes in architecture of chromatin in cells exposed to slowly increasing concentrations of daunomycin. (A) Images of fluorescence of GFP-H1.1, GFP-H2B, and daunomycin in formaldehyde-fixed cells incubated with increasing concentrations of the drug. A loss of the green signal is due entirely to fluorescence quenching; scale bar 2 μm. (B) A graph illustrating quenching of GFP on H1.1 and H2B histones by daunomycin. (C) A ratio between fluorescence intensities of histones GFP-H1.1 in nucleoli vs nuclear DNA, in fixed cells. (D) Fluorescence intensity of histones GFP-H1.1 and GFP-H2B in live cells exposed to growing concentrations of daunomycin. A loss of the green signal is due primarily to H1.1 histone dissociation and subsequent degradation. (E) A graph illustrating a decrease of fluorescence of GFP-H1 and GFP-H2B histones in live cells exposed to daunomycin. (F) A ratio between fluorescence intensities of histones GFP-H1.1 in nucleoli vs nuclear DNA, in live cells, demonstrating accumulation of histone H1.1 in nucleoli at drug concentrations above 1 μM

An official website of the United States government
Here's how you know
Official websites use .gov
A
.gov website belongs to an official
government organization in the United States.
Secure .gov websites use HTTPS
A lock (
) or https:// means you've safely
connected to the .gov website. Share sensitive
information only on official, secure websites.
