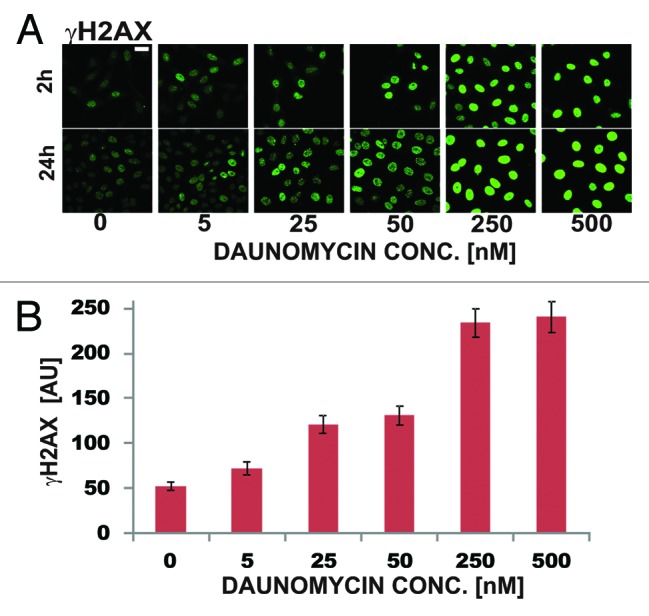
Figure 7. DNA damage assessed by means of immunodetection of histone H2AX phosphorylation in daunomycin-treated cells (2 h and 24 h). (A) images of immunolabeled histone γH2AX in cells treated with increasing concentrations of daunomycin for 2 and 24 h; scale bar 20 μm. (B) Average fluorescence intensity of immunolabeled histone γH2AX per cell, following 2 h treatment with daunomycin at different concentrations.
