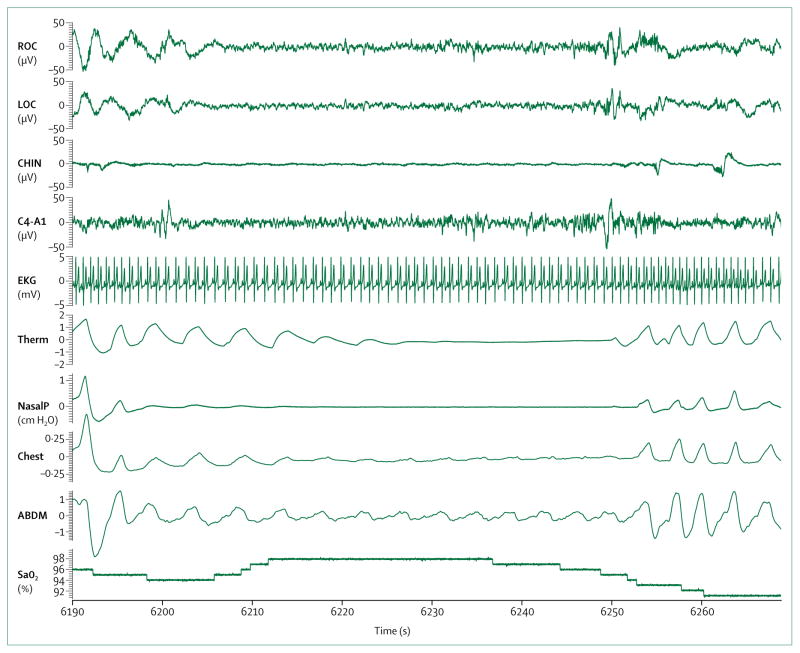
Figure 1. An example of the signals recorded during overnight polysomnography.
Shows an obstructive apnoea with cessation of airflow for more than 10 s despite persistent respiratory efforts shown on the chest and abdominal respiratory bands. The apnoea is associated with arterial oxygen desaturation and is terminated by arousal from sleep. C4-A1=electroencephalogram. LOC=left electro-oculogram. ROC=right electro-oculogram. CHIN=chin electromyogram. CHEST=respiratory inductance plethysmography bands placed around the thorax. ABDM=respiratory inductance plethysmography bands placed around the abdomen. PNasal=airflow monitoring by nasal air pressure. Therm=airflow monitoring by thermal air sensor. SaO2=arterial oxygen saturation. EKG=electrocardiogram. ABDM=abdomen.

