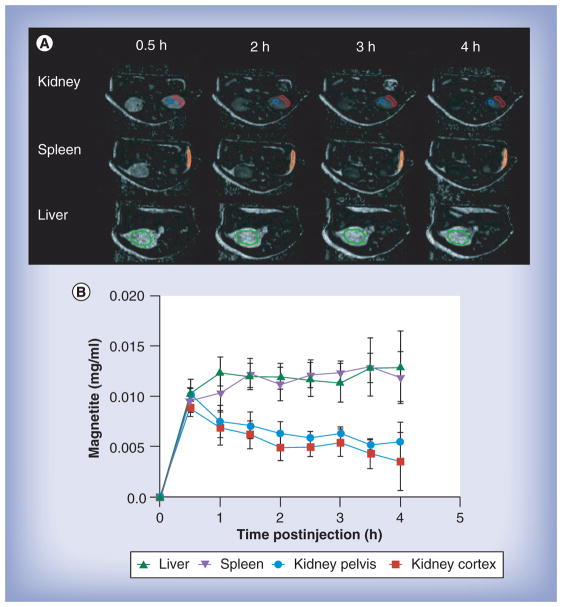
Figure 3. MRI assessments of the tissue drug biodistribution and pharmocokinetics by small magnetite antiretroviral therapy particles.
After pre-MRI scan, mice were injected with small magnetite antiretroviral therapy (SMART) through a jugular vein cannula, and then scanned by MRI at continuously at 30 min intervals up to 4 h after SMART administration. Mean tissue SMART content was determined as detailed in the ‘Materials & methods’ section. Immediately after the final scan, mice were euthanized and tissues were collected for atazanavir quantification by ultra-performance liquid chromatography tandem mass spectrometry. (A) MRI-based images of magnetite concentration in kidney, spleen and liver from 0.5 to 4 h following SMART administration. (B) Mean ± scanning electron microscope (n = 6) of magnetite levels in kidney, spleen and liver over 4 h following SMART administration.

