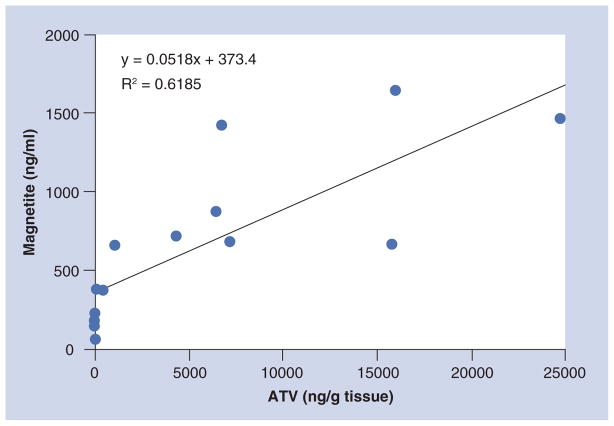
Figure 5. Correlation of small magnetite antiretroviral therapy particle-associated magnetite and atazanavir in tissues 24 h after administration.<.
br>The magnetite concentration was quantified from the change in T2 weighted relaxivity (Equation 1) and the per milligram magnetite relaxivity determined as the slope of magnetite concentration versus R2 in small magnetite antiretroviral therapy particles phantom studies. ATV concentrations were quantified by ultra-performance liquid chromatography tandem mass spectrometry following the final 24 h MRI scan.
ATV: Atazanavir; R2: Linear regression coefficient squared.

