
Figure 4. Dynamics of NtrC.
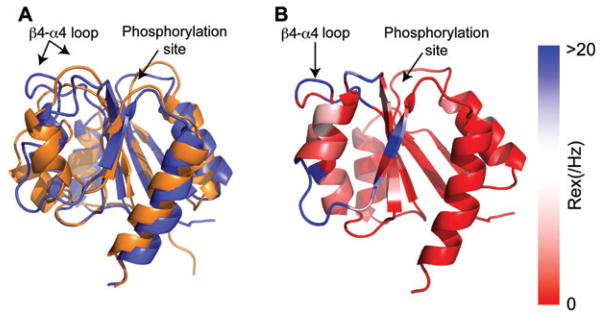
(A) Superimposition of the NMR structures of the N-terminal domain of unphosphorylated, inactive NtrC (blue, PDB 1DC7) and active NtrC (orange, PDB 1DC8) states are superimposed. (B) NMR 15N backbone Rex values (millisecond-microsecond motions) superimposed on unphosphorylated, inactive NtrC (PDB 1DC7). These data were adapted with permission from Ref (21). The NMR exchange term Rex is shown on a continuous color scale from red to blue. The color scale indicates the extent of conformational exchange between states that sense different chemical environments.