
Figure 7. Molecular dynamics simulation data.
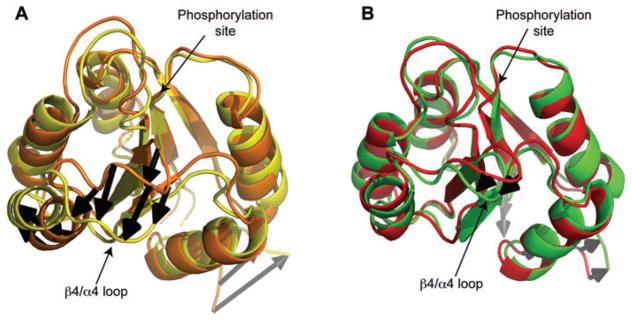
(A) Wild-type Spo0F and (B) L66A Spo0F (PDB code 2JVK). In (A), the two structures shown (orange and yellow) represent the structures from the wild-type Spo0F molecular dynamics ensemble which have the greatest root mean square deviations (RMSDs) with respect to one another. In (B), the two structures shown (red and green) represent the structures from the L66A Spo0F molecular dynamics ensemble which have the greatest RMSDs with respect to one another. The large difference in the β4-α4 recognition loop region (indicated by black arrows) for wild-type Spo0F (A) suggests significant motional propensity in this region. In the case of L66A Spo0F (B), this motional propensity is restricted.